Figure 6.
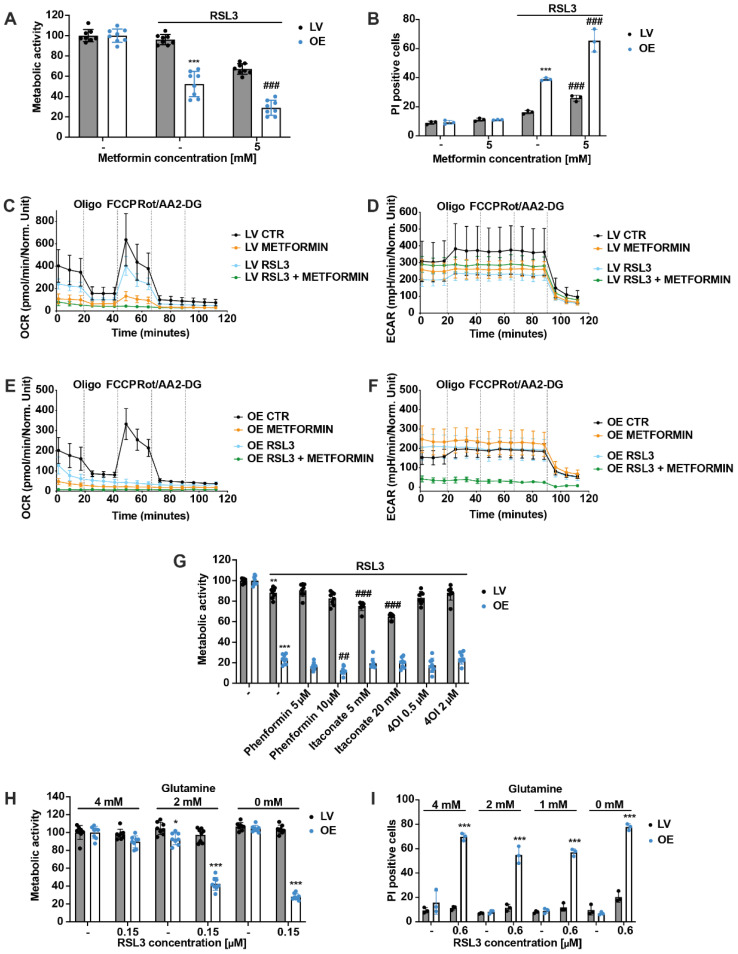
Metabolic intervention fails to prevent ferroptosis in ACSL4/LPCAT2 OE cells. (A) Metabolic activity was determined by MTT assay after 16 h treatment with 1 µM RSL3 and co-treatment with 5 mM metformin. Data are shown as percentage of control conditions, n = 8 replicates. (B) Cell death was measured by PI staining after treating HEK293T cells with 0.1 µM RSL3 and 5 mM metformin for 16 h (5000 cells per replicate of n = 3 replicates, percentage of gated cells). (C,E) Mitochondrial respiration and (D,F) glycolysis measurements by the Seahorse XF analyzer of LV (B,C) and OE (D,E) cells treated with 1 µM RSL3 and co-treated with 5 mM metformin for 16 h (n = 5–8 replicates per condition). (G) MTT assay after 16 h treatment with 1 µM RSL3 and co-treatment with 0.5 or 2 µM 4-octyl-itaconate (4OI), 5 or 10 µM phenformin, and 5 or 20 mM itaconate (Data are shown as percentage of control condition, n = 8 replicates). (H) Metabolic activity was determined by MTT assay after 16 h of exposure to 0.15 µM RSL3 in DMEM medium containing 4, 2, or 0 mM glutamine. Data are shown as percentage of control conditions of n = 8 replicates. (I) To confirm the MTT results, cells were measured by PI staining 18 h after treatment with 0.6 µM RSL3 under conditions of 4, 2, 1, or 0 mM glutamine in DMEM medium (5000 cells per replicate of n = 3 replicates, percentage of gated cells). *** p < 0.001; ** p < 0.01; and * p < 0.05 compared to control conditions and ### p < 0.001; and ## p < 0.01 compared to RSL3-treated control cells (ANOVA, Scheffé’s test).

