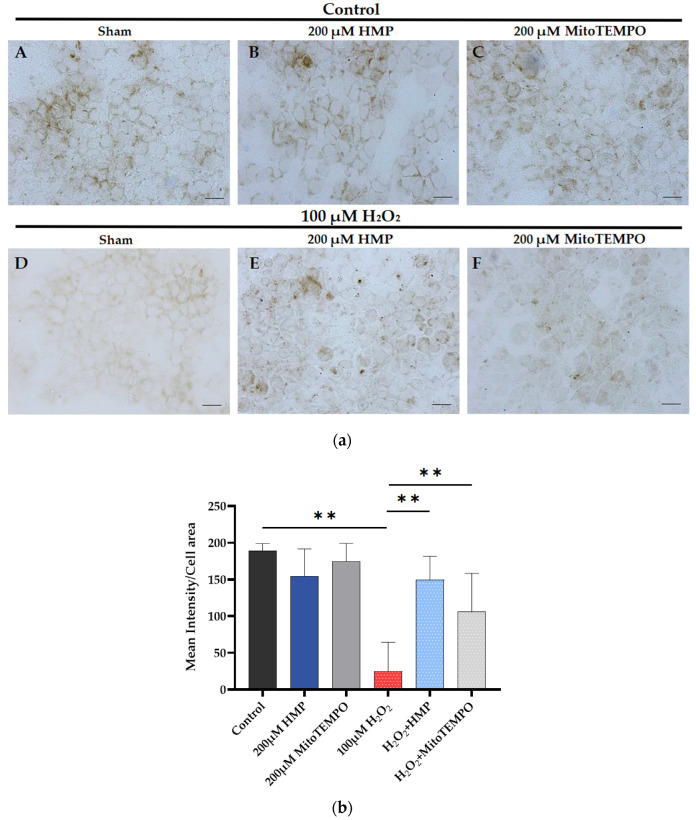
Figure 6.
HMP pre-treatment improved mitochondrial cytochrome C activity in H2O2-exposed HTR-8/SVneo trophoblast cells. (a) Representative images from different treatment groups: (A–C): control and antioxidant-treated groups, (D–F): H2O2-treated groups. Brown color indicates the COX enzyme activity. Bars: 200 μm. (b) Quantitation of COX enzyme activity in trophoblasts: Optical density per area (pixel2) of cell surface area was calculated in four high-power fields per sample (n = 5 per group). Mann–Whitney-U test, median [IQR]. Control vs. 100 μM H2O2: **: p < 0.01, 100 μM H2O2 vs. H2O2 + HMP: **: p < 0.01 and 100 μM H2O2 vs. H2O2 + MitoTEMPO: **: p < 0.01.

