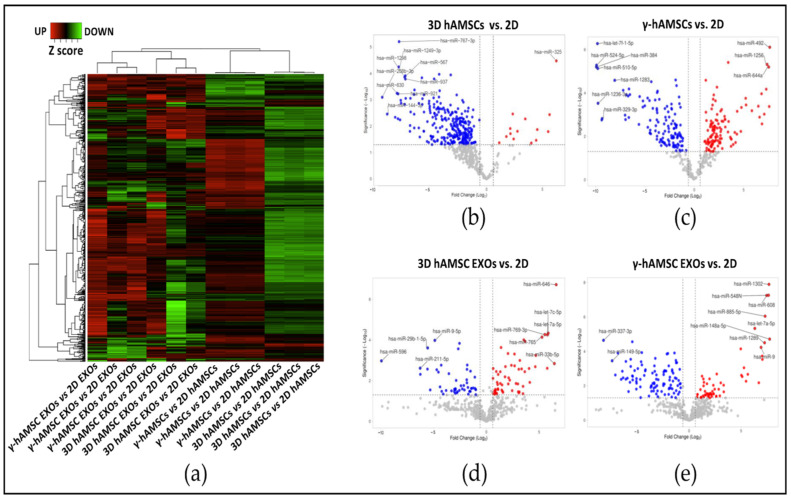
Figure 2.
Cluster analysis to compare the fold changes (FC) in miRNA expression in primed hAMSCs and their EXOs. (a) Hierarchical clustering of z score transformed FC of miRNA in each treatment group compared to 2D untreated samples (control). (b) Volcano plot analysis (fold change > 1.5 and p < 0.05) of miRNA expression in the 3D culture of hAMSCs vs. control (2D culture). (c) Volcano plot analysis (fold change > 1.5 and p < 0.05) of miRNA expression in hAMSCs treated with IFN-γ vs. control (2D). (d) Volcano plot analysis (fold change > 1.5 and p < 0.05) of miRNA expression in EXOs derived from the 3D hAMSCs vs. control (2D). (e) Volcano plot analysis (fold change > 1.5 and p < 0.05) of miRNA expression in EXOs derived from hAMSCs treated with IFN-γ vs. control (2D). For all the volcano plots in the figure, red dots represent the up-regulated miRNAs in the experimental samples, while the blu dots represent the miRNAs up-regulated in the experimental controls.

