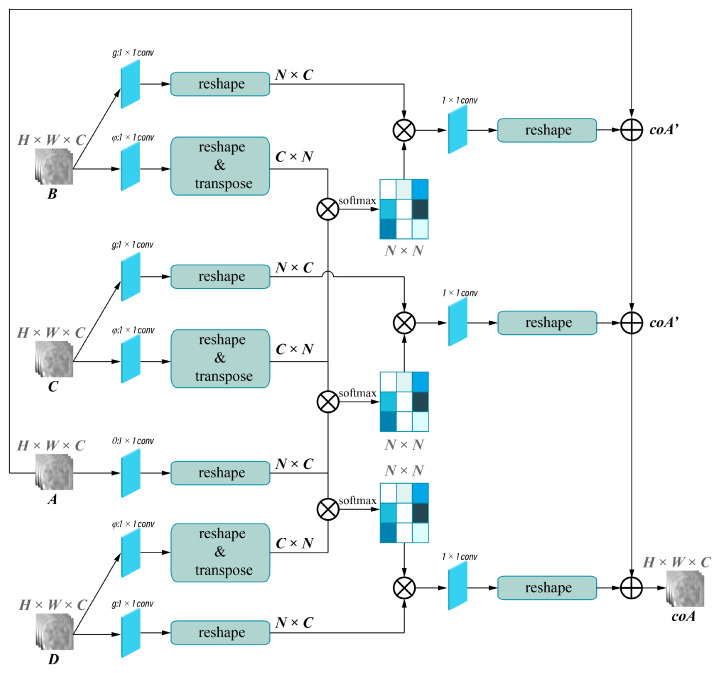
Figure 5.
Collaborative-attention block. A, B, C, and D indicates input images of different phases from self-attention layers, and coA indicates output images of collaborative-attention layers. Input size of the image is H × W × C. H, W, and C represent the height, the width, and the output channel of the image, respectively. N = H × W. The different shade colors in N × N indicates the obtained attention coefficient (0–1), and dark colors indicates higher attention coefficient.

