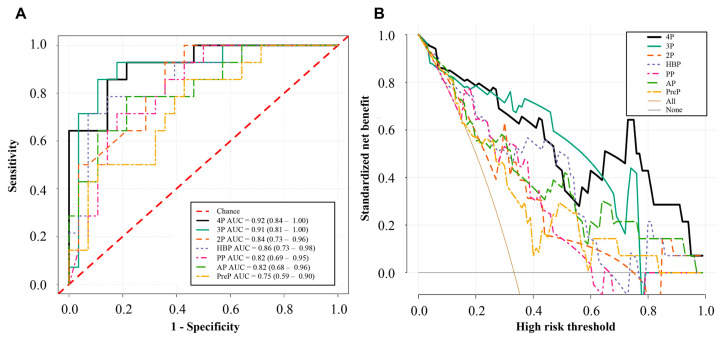
Figure 6.
Receiver operating characteristic curves (A) and decision curve analysis (B) of different models in the test set. PreP represents the pre-contrast phase model; AP represents the arterial phase model; PP represents the portal phase model; HBP represents the hepatobiliary phase model; 2P represents the fusion model of the arterial and portal phases; 3P represents the fusion model of the arterial, portal, and hepatobiliary phases; 4P represents the fusion model of the four phases.

