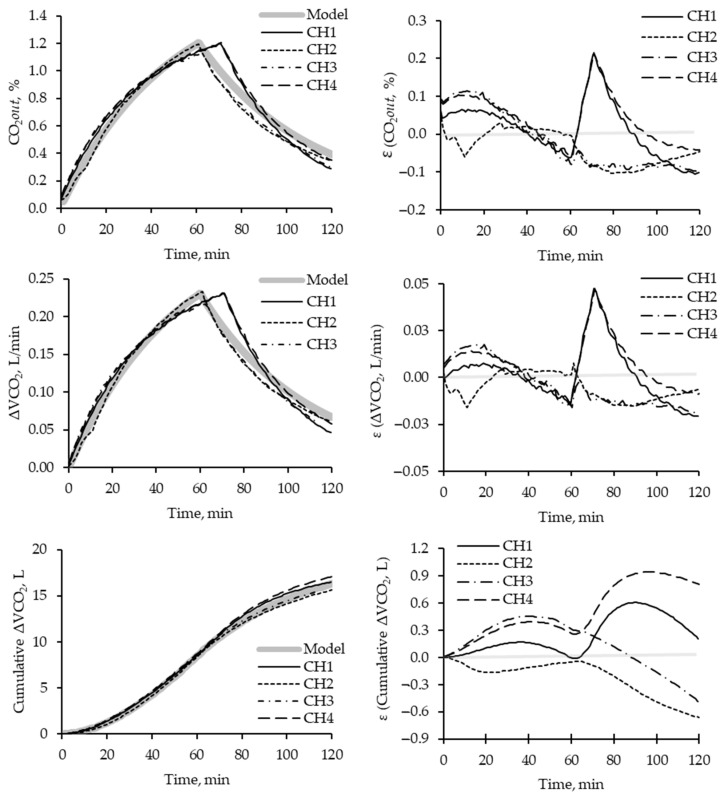
Figure 4.
Dynamic (per minute) of the injection of known concentration of CO2 injected on each chamber and description of parameters of CO2out(ti), ΔVCO2, or Cumulative ΔVCO2, and the error calculated for each time. Each line represents the behavior of each chamber (CHn, where n refers to different chambers). The shadow line describes the expected results per unit of time according to the simulation.

