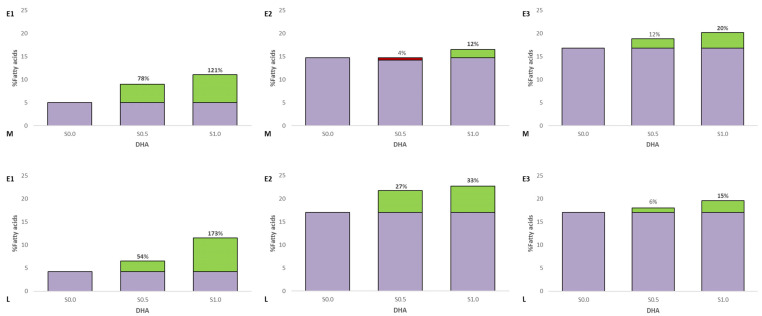
Figure 4.
DHA content in the fat of the muscle (M) and liver (L) of the experimental fish (Siberian sturgeon E1, rainbow trout E2, Euroasian perch E3). Red indicates a decrease and green indicates an increase in relation to the control group. Bold numbers show columns with significantly different results (p ≤ 0.05).

