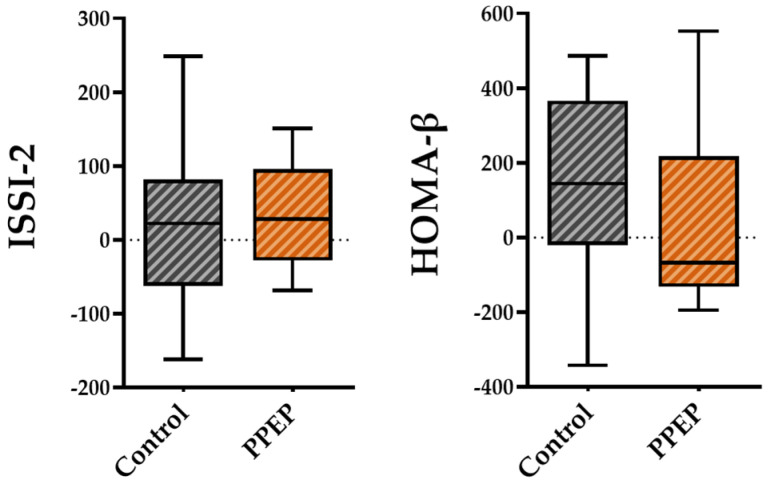
Figure 4.
Intergroup comparison of variations in pancreatic beta cell function indexes between the control and PPEP groups. The variations were calculated using the following formula: (3 months post-supplementation − baseline). Comparison between groups was performed using a paired t-test for normally distributed data and a Wilcoxon test for non-normally distributed data. ISSI-2, insulin secretion-sensitivity index-2; HOMA-β, homeostasis model assessment of beta cell function.

