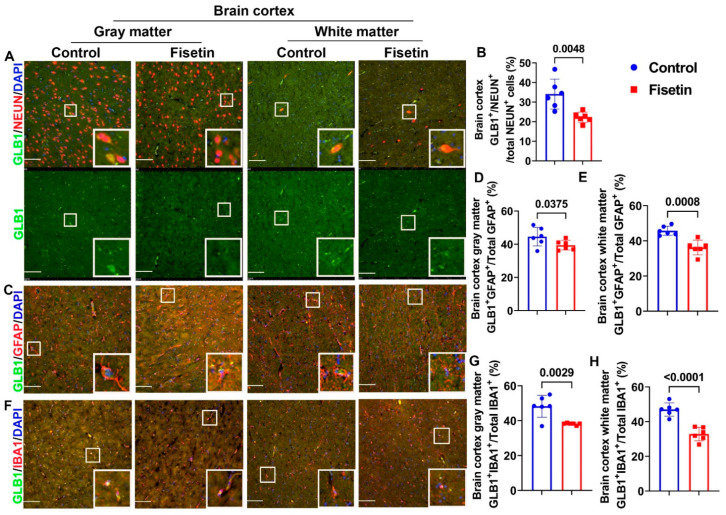
Figure 4.
Identification of senescent cells in the brain cortex using double IF staining of GLB1 with different neuronal markers. (A) Double IF of GLB1 with NEUN. NEUN+ neurons are stained in red in the nuclei and perinuclear cytoplasm, while GLB1 is stained in green in the cytoplasm. Nuclei are stained in blue with DAPI. Colocalized cells are stained in orange/yellow. The green channel shows GLB1 staining. (B) Quantification of GLB1+NEUN+/Total NEUN+ cells percentage in the gray matter of the brain cortex. (C) Double IF of GLB1 with GFAP. GFAP+ cells are stained in red, showing many projections. GLB1+GFAP+cells are shown in orange, highlighted in the insets. (D) Quantification of GLB1+GFAP+/Total GFAP+ cells percentage in the gray matter of the brain cortex. (E) Quantification of GLB1+GFAP+/Total GFAP+ cells percentage in the white matter of the brain cortex. (F) Double IF for GLB1 and IBA1. IBA1+ cells are stained in red color, and are small with few projections. (G) Quantification of the GLB1+IBA1+/total IBA1+ cells percentage in the gray matter of the brain cortex. (H) Quantification of the GLB1+IBA1+/total IBA1+ cells percentage in the white matter of the brain cortex. Scale bars = 100 µm. White boxes in each image highlight positive cells. Exact p values are shown between the group bars.

