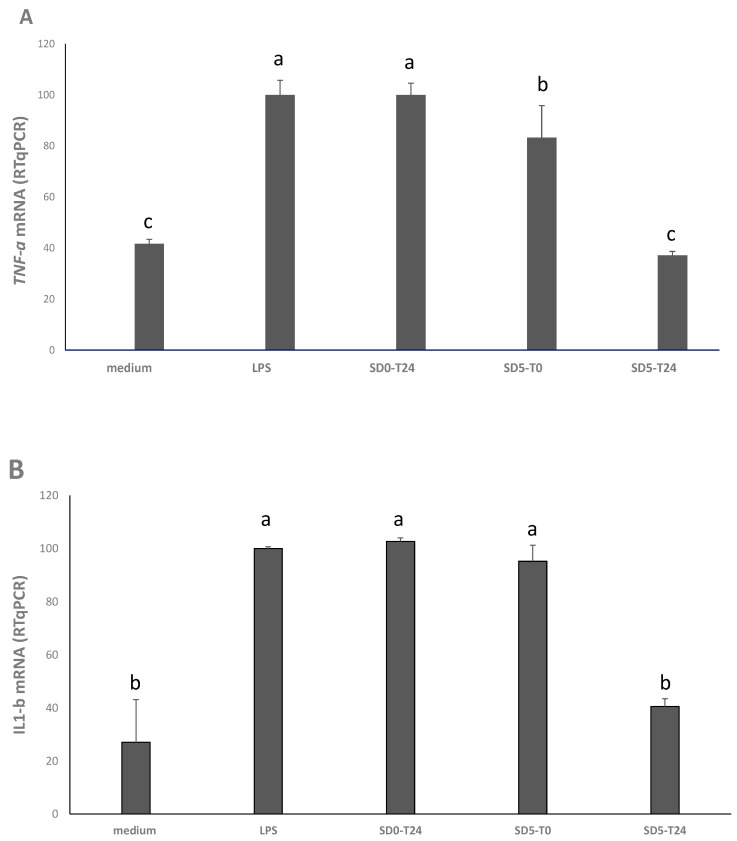
Figure 2.
Expression of the tumor necrosis factor alpha (TNF-α) (panel A) and interleukin1 beta (Il-1β) (panel B) genes in Caco2 cells as determined by RT-PCR. Caco2 cells were treated at 37 °C for 24 h, under 5% CO2, with: basal medium (negative control); basal medium with LPS (10 μg/mL) (positive control, LPS); and 10 μg/mL of the freeze-dried extracts from SD0 and SD5, before (T0) and after (T24) sourdough fermentation. Results are expressed as percent ratio to LPS treatment. Values are means of two experiments in triplicate. a–c Values with different superscript letters differ significantly (p < 0.05). Bars of standard deviations are also represented.

