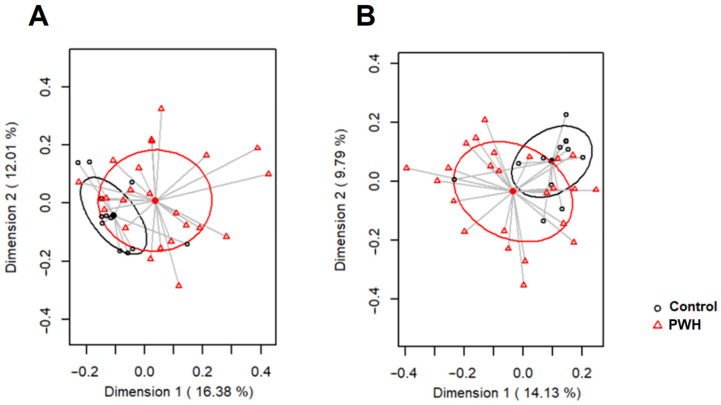
Figure 1.
PCoA plots of bacterial profiles (at the OTUs level), based on the Bray–Curtis similarity analysis (A) and Jaccard’s coefficient for binary data (B) from the fecal samples of control patients (control, black circles) and PWH patients (red triangles). The percentage of the total variance is explained by each axis.

