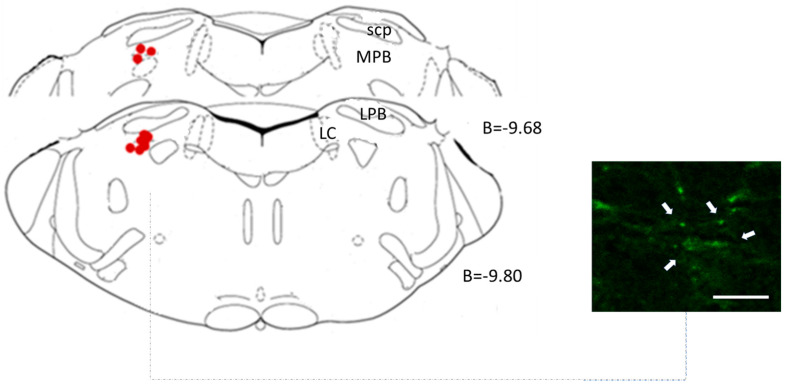
Figure 2.
Illustration of targeted regions within the LPBN for lentiviral microinjection (red dots). The delineated areas indicate the specific points of lentiviral vector insertion, offering a comprehensive spatial perspective of the experiment. B-bregma; LC-Locus coeruleus; LPB-lateral parabrachial nucleus; scp-superior cerebellar peduncle (plates based on Paxinos and Watson [22]). The scale bar (white arrow) measures 50 μm.

