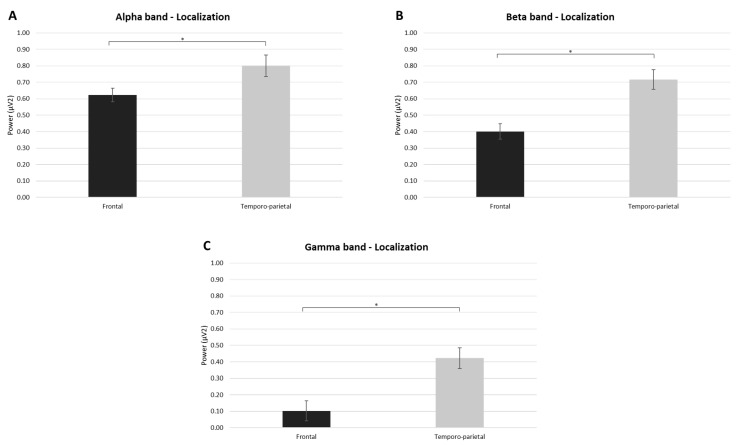
Figure 3.
EEG results. (A) The bar graph shows significant differences for the alpha band in Localization. (B) The bar graph shows significant differences for the beta band in Localization. (C) The bar graph shows significant differences for the gamma band in Localization. For all graphs, bars represent ± 1 standard error and stars (*) mark statistically significant comparisons.

