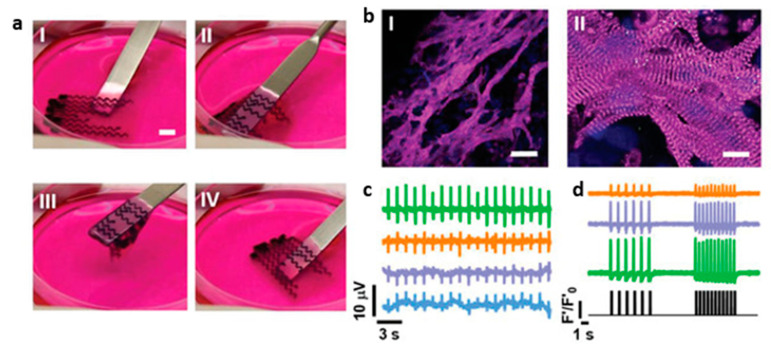
Figure 13.
Bioprinted cardiac patch with integrated electrodes. (a) The patch is soft and flexible and the electrodes can be seen in black. I–IV show the patch being picked up and returned to the culture plate. (b) Immunostaining for sarcomeric actinin (pink) and nuclei (blue). Scale bars are 50 and 10 µm for I and II, respectively. (c) Recordings of action potentials from four distinct locations. (d) Calcium transients from three distinct locations after pacing at 7 V and 1 and 2 Hz. The pacing pattern is shown at the bottom of the panel. Reprinted with permission under open access from Asulim et al. [164].

