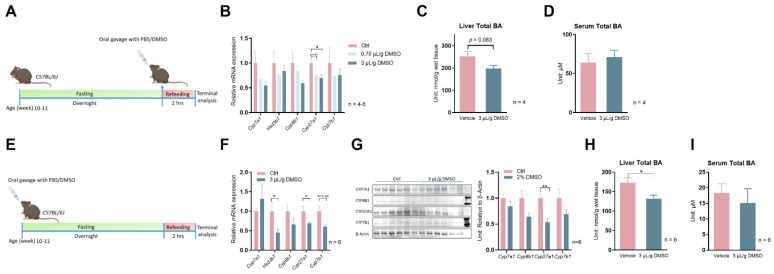
Figure 2.
DMSO inhibits expression of bile acid synthesis in mouse livers. (A) Schematic representation of mouse treatment for panels (B–D). (B) Expression of Cyp7a1, Hsd3b7, Cyp8b1, Cyp27a1, and Cyp7b1 after one bolus of 0.75 or 3 μL/g (v/w) DMSO oral gavage (15 μL/g body weight) and 2 h refeeding following overnight fasting in C57Bl/6J wild–type (WT) mice; n = 5 for the control group, n = 5 for the 0.75 μL/g DMSO group, n = 4 for the 3 μL/g DMSO group. (C) Total liver BA level, (D) serum total BA level 2 h after one bolus of 3 μL/g (v/w) DMSO oral gavage (15 μL diluted DMSO/gram body weight) in WT mice. For panels (C,D), n = 4 for each group. (E) Schematic representation of mouse treatment for panels (F–I). (F) Expression of Cyp7a1, Hsd3b7, Cyp8b1, Cyp27a1, and Cyp7b1 24 h after one bolus of 3 μL/g (v/w) DMSO oral gavage (15 μL diluted DMSO/gram body weight) in WT mice. (G) Western blots of CYP7A1, CYP8B1, CYP27A1, CYP7B1 proteins; densitometry results of proteins signal normalized to β–Actin are shown on the right (Full Western blots figures refer to Supplementary Materials). (H) Total liver BA level, (I) serum total BA level from panel (E); for panel (F–I), n = 6 for each group. All data are mean ± SEM; * p < 0.05, ** p < 0.01, relative to the control group.

