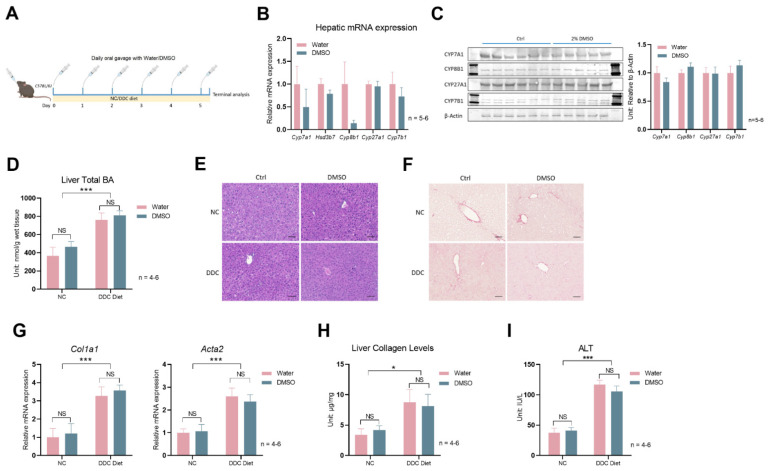
Figure 3.
DMSO does not protect mice from 0.1% DDC–diet–induced liver damage. (A) Schematic representation of mouse treatment: C57Bl/6J WT mice were kept on normal chow (NC) or 0.1% DDC diet with a daily oral gavage of PBS or 3μL/g body weight (v/w) DMSO (15 μL/g body weight) for 5 days. (B) Expression of Cyp7a1, Hsd3b7, Cyp8b1, Cyp27a1, and Cyp7b1 in liver. (C) Western blots of CYP7A1, CYP8B1, CYP27A1, CYP7B1 proteins; densitometry results of proteins signal normalized to β–Actin are shown on the right (Full Western blots figures refer to Supplementary Materials). For panel (B,C), n = 6 for the ctrl group, n = 5 for the 3μL/g DMSO group. (D) Total liver BA level in WT mice kept on NC or 0.1% DDC diet with regular water or DMSO water treatment for 5 days. (E) Representative liver H&E staining and (F) Sirius Red staining in mice described in panel (D). (G) Hepatic expression of Col1a1 and Acta2 in mice from panel (D). (H) Liver collagen levels in mice from panel (D). (I) Serum alanine transaminase (ALT) levels in mice from panel (D). For panels (D–I), n = 4 for the control group, n = 5 for the DMSO group, n = 6 for the DDC group, and n = 5 for the DDC + DMSO group. Two–way ANOVA was used for panels (D), (G–I). All data are mean ± SEM. NS: not significant; * p < 0.05, *** p < 0.001.

