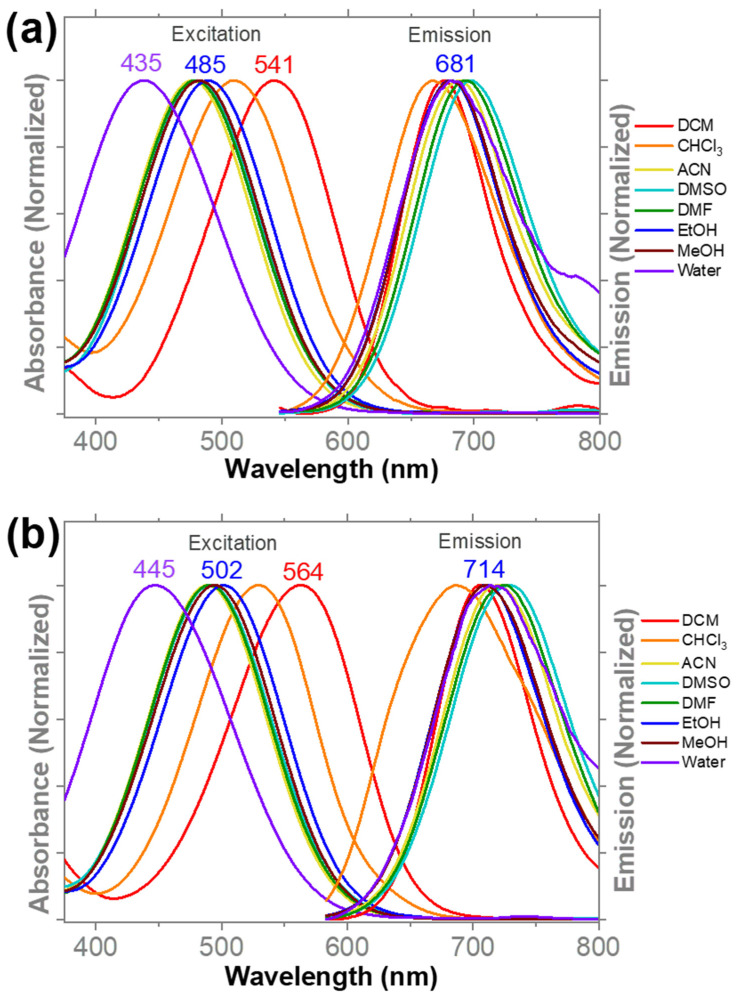
Figure 1.
Normalized absorbance and emission spectra acquired for probe 1a (a) and 1b (b) in different solvents. Optical spectra were recorded for probes at 1 × 10⁻⁶ M and 25 °C. For the emission collection, probe 1a was excited at 500 nm and 1b was excited at 520 nm. Emission spectra were collected from 540 nm to 800 nm range.

