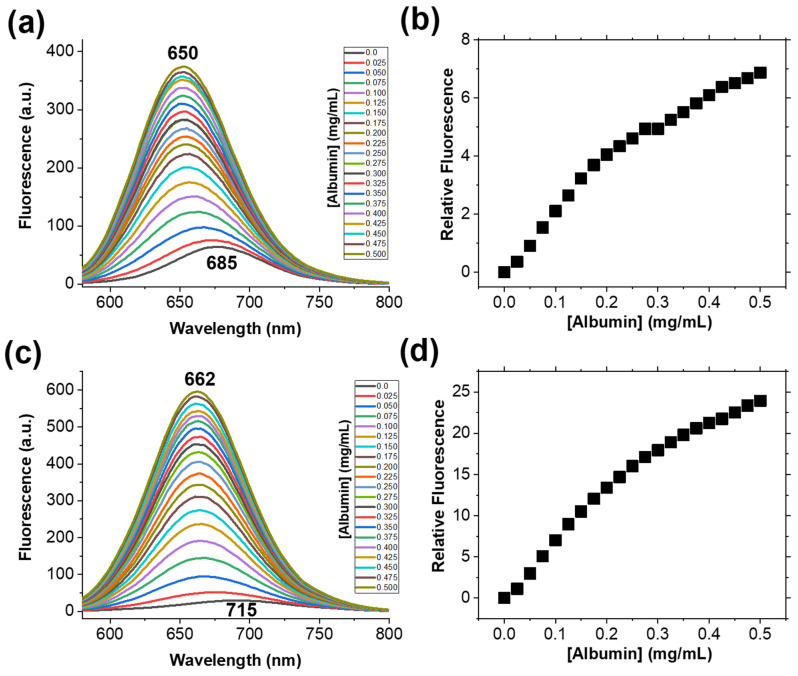
Figure 2.
The fluorescence emission spectra acquired during the spectrometric titrations of probes 1a (a) and 1b (c) at 1 × 10⁻⁶ M concentration with a 5% HSA solution in water at room temperature. Figures (b) and (d) represents the relative fluorescence signal recorded at the emission maxima as a function of HSA concentration in the solution for probes 1a and 1b, respectively. Probes were excited at 520 nm and the emission spectra were collected from 540 nm to 800 nm range.

