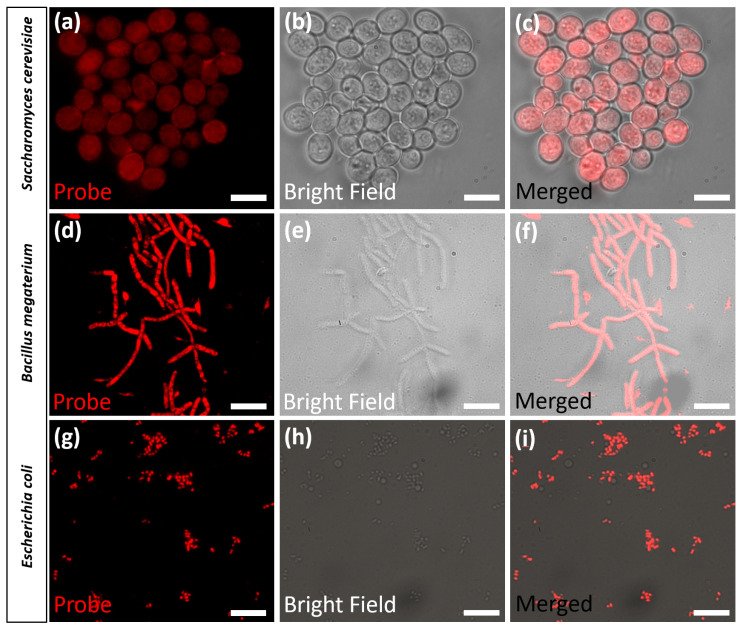
Figure 4.
Fluorescence microscopy images obtained from Saccharomyces cerevisiae (a–c), Bacillus megaterium (d–f), and Escherichia coli (g–i), stained with probe 1a (10 µM) for 30 min. Images (a–i) represents, probe 1a emission in the cells (a,d,g), bright field images (b,e,h), and merged images (c,f,i). Images were acquired by exciting the stained organisms with 532 nm laser line with standard Cy3 filter settings (580–620 nm) for the emission collection. The scale bar indicates a 20-micron region.

