Figure 6.
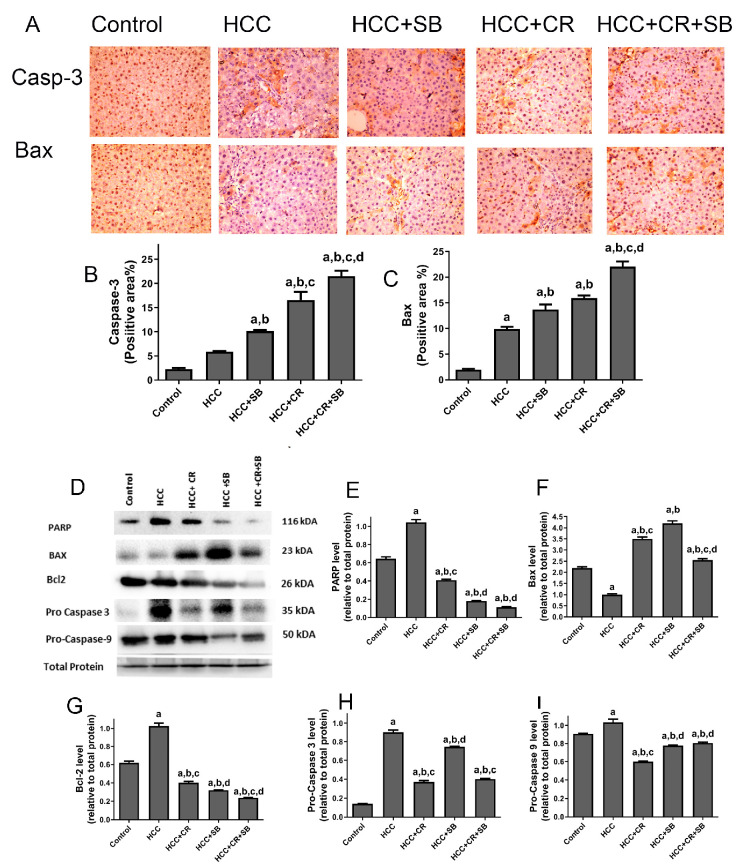
Effects of CR, SB, and CR + SB on apoptotic cell death. (A) Representative images exhibiting Bax and caspase 3 IHC staining of liver tissue sections corresponding to all groups (B,C) show the corresponding IHC-positive staining area graph of Bax and caspase 3-positive area in different experimental groups. The IHC staining of Bax and caspase 3 in each section was calculated by positive area of brown staining in ten fields at ×400 magnifications then the area of positive cells/field. (D) Western blot analysis showing the decreased expression of Bcl-2, Pro caspase-3, and Pro caspase-9, and the increased expression of Bax in SB, CR, and CR + SB treated groups. (E–I) show densitometric analysis representing the expression of PARP, Bax, Bcl-2, Pro caspase-3, and Pro caspase-9 normalized to that of total protein. Values expressed as mean ± SEM for six animals in each group. Significance was determined by one-way analysis of variance followed by Tukey’s post hoc analysis: a p < 0.05 vs. control group; b p < 0.05 vs. HCC group; c p < 0.05 vs. HCC + SB group; d p < 0.05 vs. HCC + CR group. Original western blots are Presented in Files S1.

