Figure 2.
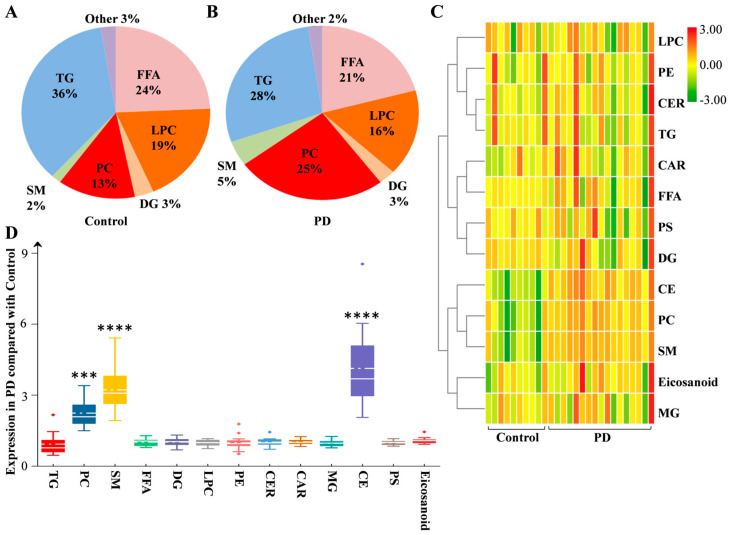
Lipid families from CSF in PD. The detected lipid species were classified into 13 families. According to the expression, the proportions of each lipid family in the control (A) and PD (B) groups are listed. (C) Heatmap representing all 13 lipid families obtained by UPLC–MS/MS. (D) The fold changes in the expression of lipid families between the PD and control groups are shown as box plots. Differences were determined by Student’s t test, with *** p < 0.001, **** p < 0.0001 by the Mann–Whitney test. The solid line in the box represents the mean lipid expression, and the dotted horizontal line represents the median lipid expression. Abbreviations: PD, Parkinson’s disease; TG, triglyceride; PC, phosphatidylcholine; SM, sphingomyelin; FFA, free fatty acid; DG, diglyceride; LPC, lysophosphatidylcholine; PE, phosphatidylethanolamine; CER, ceramide; CAR, 3-hydroxy-dodecanoyl-carnitine; MG, monoglyceride; CE, cholesterol ester; PS, phosphatidylserine.

