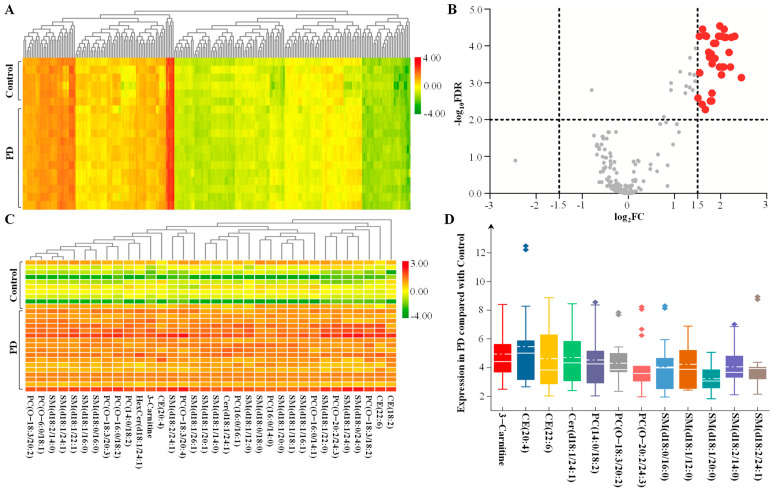
Figure 4.
Lipid signature from CSF in PD. (A) Heatmap representing all 231 lipid species obtained by UPLC–MS/MS. (B) The volcano plot of the differential lipid species in the PD group compared with the control group. The red spots represent upregulated lipids that met −log10(FDR) > 2 and log2FC > 1.5, and grey dots represent insignificant differences. (C) The lipids with −log10(FDR) > 2 and log2FC > 1.5 were used to draw the characteristic lipidomic signature in the heatmap. (D) The fold change in the expression of lipids with log2FC > 2 is shown as a box plot. The solid line in the box represents the mean lipid expression, and the dotted horizontal line represents the median lipid expression. Abbreviations: PD, Parkinson’s disease; FC, fold change; FDR, false discovery rate; PC, phosphatidylcholine; SM, sphingomyelin; CER, ceramide; CE, cholesterol ester.

