Figure 3.
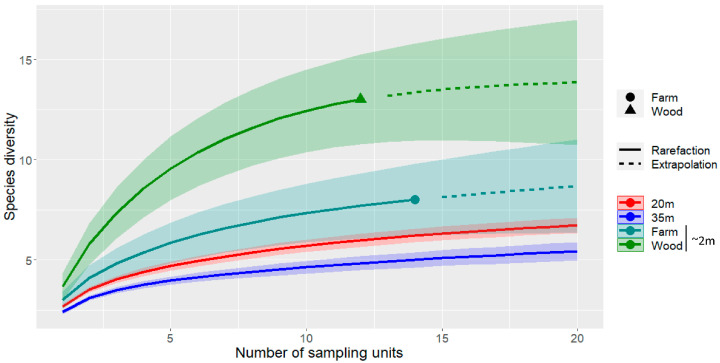
Sample-size-based (solid line) and extrapolation (dashed) sampling curves for species richness (q = 0) recorded using acoustic methods at three different heights (~2 m, 20 m, and 35 m), using two landcover types for ground sampling (~2 m): open farmlands (farm) and dense woodlands (wood). Shaded areas represent 95% confidence intervals.

