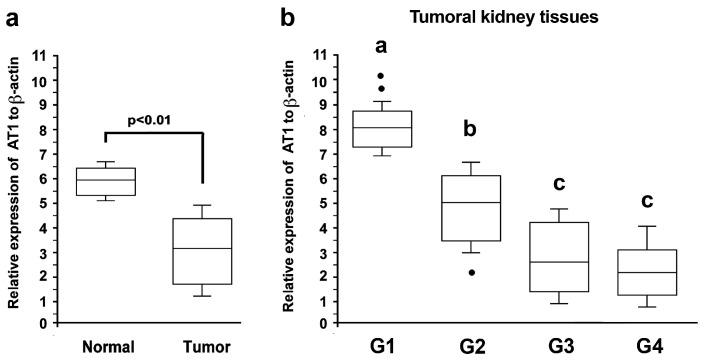
Figure 1.
Expression of AT-1R mRNA in the kidney tissue. (a) The total RNA was extracted from 42 tumoral kidney tissues and 40 normal kidney tissues, and real-time qPCR analyses targeting the expression of AT-1R were performed (statistical analysis by Mann–Whitney U test: p < 0.001). (b) Tumoral kidney tissues were classified as G1 (n = 6), G2 (n = 9), G3 (n = 13), and G4 (n = 14). Gene expressions were normalized by individual β-actin. Values refer to the mean data ± SD (statistical analysis by ANOVA: p < 0.001). Different letters indicate significantly different values under the post hoc Bonferroni test.

