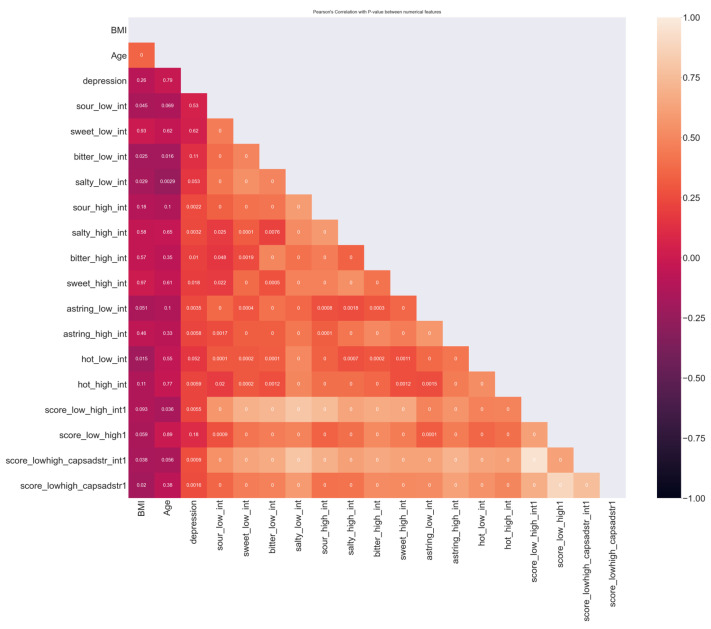
Figure 1.
Linear correlation analysis between the numerical features of the dataset and those between numerical features and the target. The bar color on the right side on the Y axis represents the value of linear correlation between features. p values are indicated inside each square and derived from Pearson’s coefficient analysis.

