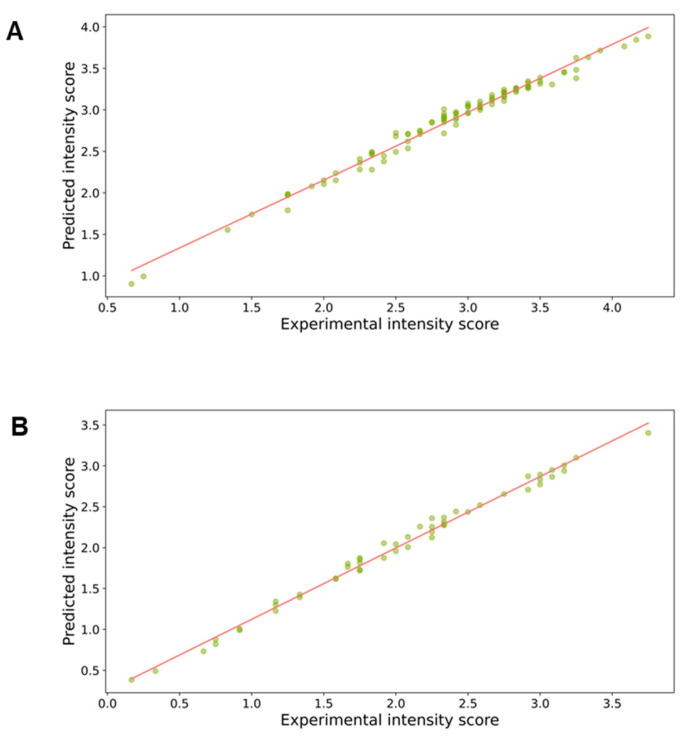
Figure 2.
Scatterplots of experimental values vs. predicted values (dots) of the overall status obtained with the random forest regressor in healthy controls (n = 102) (A) and in patients with chemosensory loss (n = 51) (B). The lines represent the relationships between the predictive and experimental (independent and dependent) variables.

