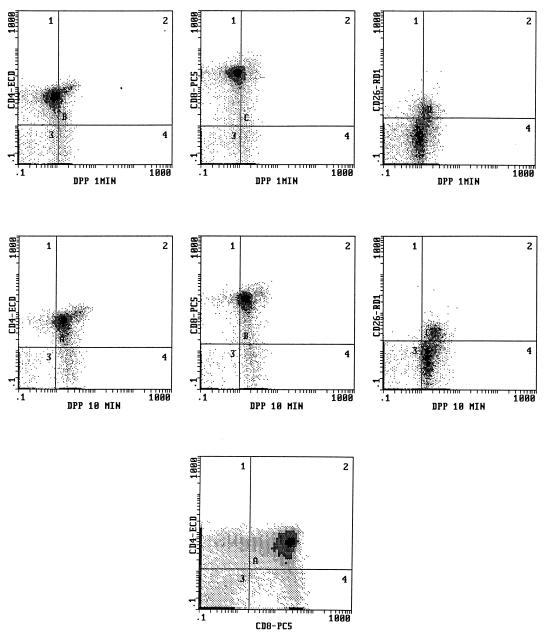
FIG. 2.
Four-color flow cytometry analysis of human thymus cells for the simultaneous determination of DPP IV activity and expression of other surface molecules, as described in Materials and Methods. Shown are two-parameter histograms with DPP IV activity in CD4+, CD8+, and CD26+ cells at 1 (top) and at 10 (middle) min of incubation. The predominant pattern of CD4 and CD8 coexpression is demonstrated in the bottom histogram.

