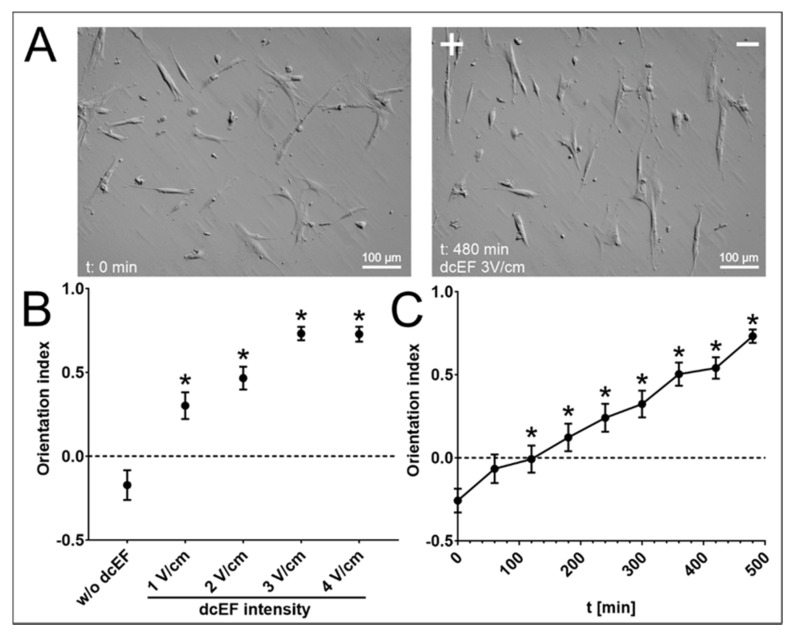
Figure 2.
Orientation of NA HBF in dcEF compared to isotropic conditions. (A) Cell morphology before and after 8 h of application of 3 V/cm of dcEF. The positive electrode (anode) of dcEF (if present) is located on the left side of the field of view. (B) Orientations of the long axes of NA HBF in relation to the electric field vector (and EF lines). Mean orientation index for cell population (n = 50) after 8 h of exposure to EF of specified strength (1–4 V/cm) ± SEM. A value of 0 denotes random orientation, while a value of 1 denotes perpendicular orientation and a value of −1 denotes parallel orientation of the long axes of cells to EF lines. * statistically significant values compared to those of the control (p < 0.05) (C) Change in orientation index over time. 3 V/cm of dcEF was applied to NA HBF for 8 h, and cell orientation was assessed every hour as the mean value ± SEM (n = 50). * statistically significant values compared to the initial time point (p < 0.05).

