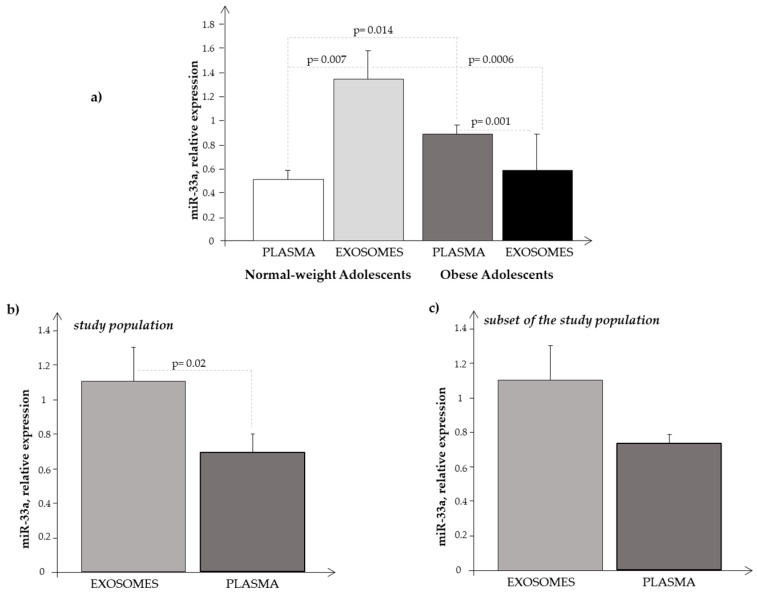
Figure 6.
Expression level of miR-33a obtained in (a) plasma and in exosome samples in normal-weight (light-grey bar) and obese (black bar) subjects, respectively; (b) in plasma (light-grey bar) and in exosome (black bar) samples considering the subjects as a whole (N + O); and (c) in plasma (light-grey bar) and in exosome (black bar) samples considering the subjects of the Ssp as a whole (N + O).

