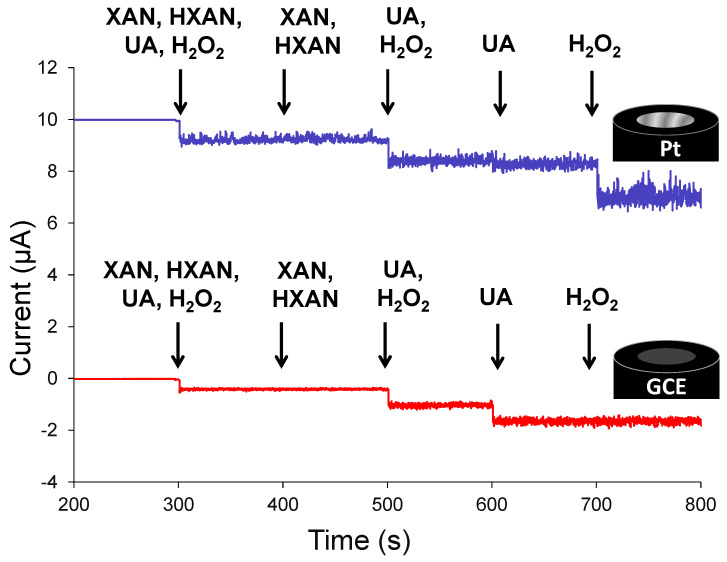
Figure 2.
Representative I-t curves for clean (unmodified) platinum (top) and glassy carbon (bottom) electrodes, held at +0.65 V and monitored for oxidative (i.e., anodic) current during standardized 20 µL injections of 10 mM four-component mixtures, two-component mixtures, or individual electroactive species, resulting in 100 µM solutions in 10 mM PBS (pH 7) bulk solution. Note: I-t curve at Pt (top trace) is offset +10 µA for clarity.

