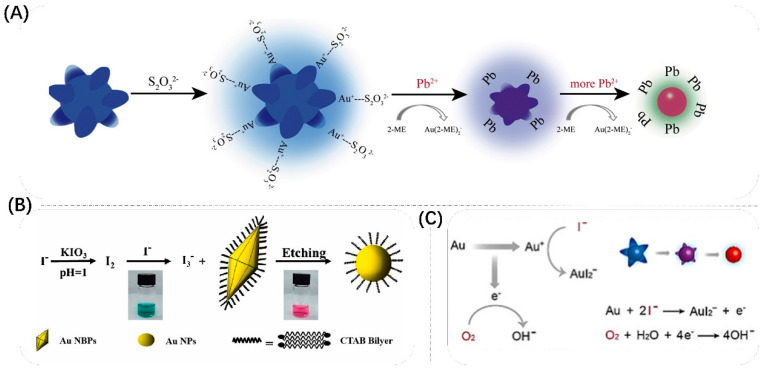
Figure 12.
(A) Schematic diagram of Pb2+ detection by its catalytic activity after being reduced to Pb on etching GNSs in the presence of Na2S2O3 and 2-ME. Reproduced with permission from [117]. Copyright 2021, Elsevier. (B) Schematic diagram of colorimetric detection of iodine-etched Au NBPs. Reproduced with permission from [118]. Copyright 2023, Elsevier. (C) Illustration of the proposed mechanism and morphological change during the surface etching of Au NSs. Reproduced with permission from [121]. Copyright 2021, Wiley.

