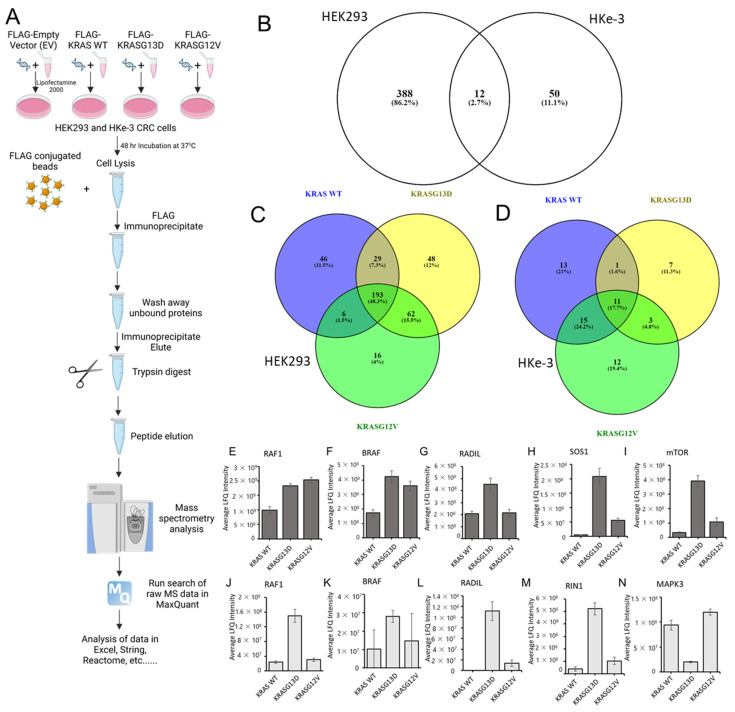
Figure 2.
(A) Graphical representation of the mass spectrometry affinity purification protocol for KRAS WT, KRASG13D, and KRASG12V in HEK293 and HKe-3 cell lines. Cells were transfected with FLAG-tagged KRAS WT, G13D, and G12V DNA constructs. Cells were lysed after 48 h and incubated with FLAG-M2 conjugated to agarose. Following washes of the beads with lysis buffer, samples were prepared for trypsin digestion. Mass spectrometer protein searches of the raw data were conducted using Max Quant to quantify protein abundance associated with each bait. LFQ intensity of the protein for each condition was used to identify specific KRAS interactors in both cell lines. Created with BioRender.com. (B) Venn diagram representing the number of specific protein interactions binding to KRAS proteins (sorted by gene name) in HEK293 and HKe-3 cell lines (C) Venn diagram representing the specific interactors of the indicated KRAS proteins identified in AP-MS proteomics in HEK293 and (D) HKe-3 cell lines. (E–I) graphs show the average LFQ in HEK293 cells of the indicated proteins in immunoprecipitates of KRAS WT, KRASG13D, or KRASG12V as indicated (n = 3). Error bars show SEM. (J–N) graphs show the average LFQ in HKe-3 cells of the indicated proteins in immunoprecipitates of KRAS WT, KRASG13D or KRASG12V as indicated (n = 3). Error bars show SEM.

