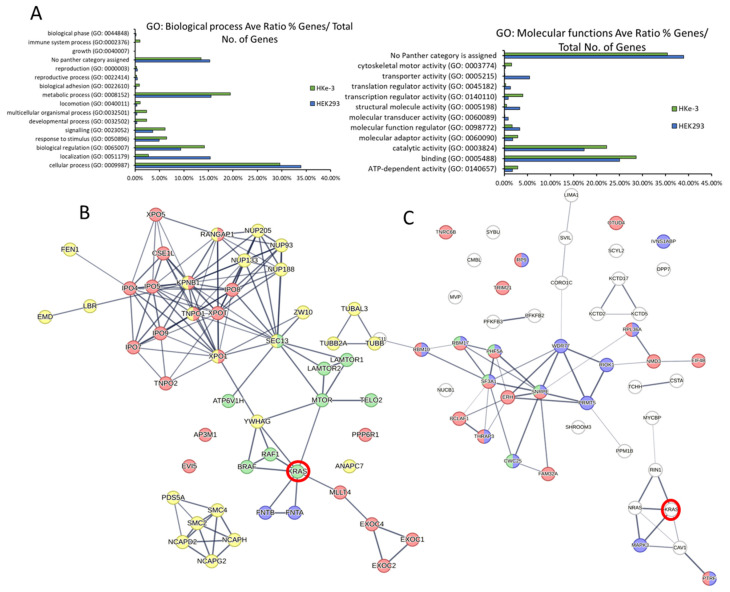
Figure 3.
(A) The specific KRAS interactomes in HEK293 and HKe-3 cells identified by AP-MS were input into the Panther analysis tool. Graphs show representation of GO terms enriched for biological processes (left) and molecular functions (right). (B) Pathway reconstruction and cluster analysis performed with StringDB show HEK293 specific protein interactors of KRAS that are exclusive to the HEK293 cell line that are part of functional clusters. Red halo indicates the KRAS node. Edges represent confidence, line thickness indicates the strength of data support. Proteins coloured red are involved in RAS GTPase binding. Proteins coloured green are involved in mTOR signalling pathway. Yellow proteins are involved in Cell cycle-mitotic. Blue are proteins of the farnesyltransferase complex. (C) Specific protein interactors of KRAS that are exclusive to the HKe-3 cell line were reconstructed using StringDB. Red halo indicates the KRAS node. Edges represent confidence, line thickness indicates the strength of data support. Proteins coloured red are involved in RNA binding; proteins coloured blue are involved in RNA metabolic processing; green proteins are involved with the spliceosome.

