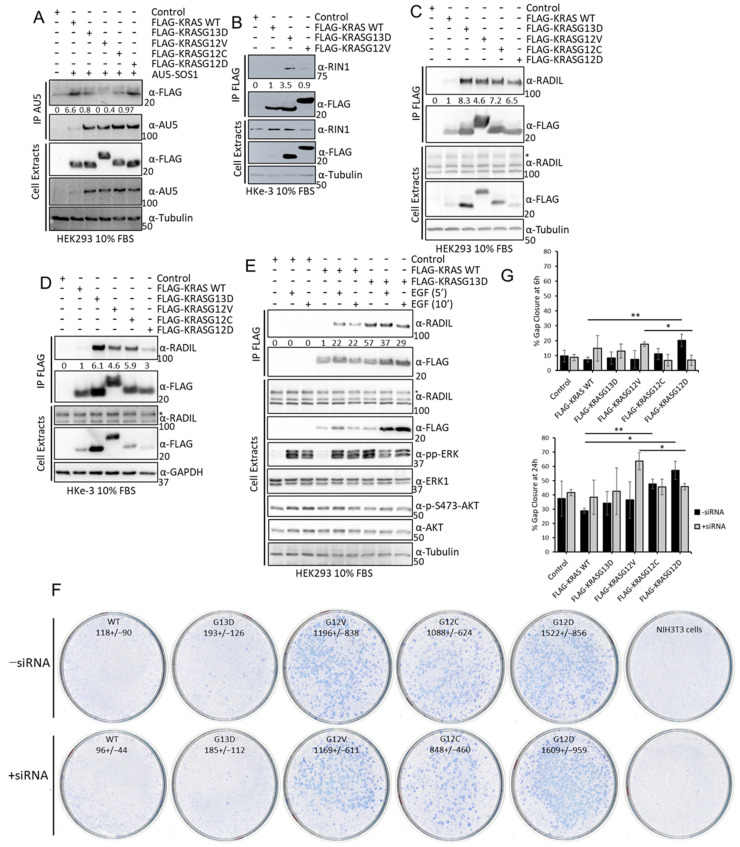
Figure 4.
(A) HEK293 cells were transfected with the indicated FLAG-tagged KRAS proteins and AU5-SOS1. Cells were lysed after 48 h and IP of AU5-SOS1 was performed using the specific antibody. IPs and cell extracts were blotted with the indicated antibodies. (B) HKe-3 cells were transfected with empty vector, FLAG-KRAS WT, -KRASG12V, or -KRASG13D. Cell lysates were incubated with anti-FLAG antibody and immunoprecipitates were blotted with the indicated antibodies. Band intensities were measured using ImageJ and numbers show fold changes of the ratio RIN1/FLAG intensity in the IPs. (C) HEK293 cells or HKe-3 cells (D) were transfected with empty vector or the indicated KRAS plasmids and lysates were IP using FLAG antibody and blotted with the indicated antibodies. Numbers show fold changes of RADIL/FLAG intensities as measured using ImageJ. * indicates specific RADIL band in the cell extracts. (E) HEK293 cells were transfected with empty vector, FLAG-KRAS WT or –KRASG13D. Following 16 h serum deprivation cells were treated with EGF (3 μM) for the indicated times and lysed 48 h after transfection. FLAG IP was performed with the cell extracts followed by Western blotting with the indicated antibodies. Numbers show fold change in RADIL interaction with FLAG-KRAS proteins. Band intensity was measured using ImageJ. The whole Western blot figures can be found in Supplementary Materials Original Blots and quantification for Figure 4. (F) NIH3T3 were transfected with 200 ng of FLAG-KRAS WT (WT), -KRASG13D (G13D), -KRASG12V (G12V), -KRASG12C (G12C), -KRASG12D (G12D), or empty vector and/or RADIL siRNA (20 nM); 14 days after, transfection plates were fixed and stained with Giemsa and macroscopic foci were counted. Numbers show average number of foci per 1 ug DNA +/− standard deviation (SD) (n = 3). (G) Cells transfected as in A were grown to confluence in a plate with a rubber stopper. Stoppers were removed and images were taken at the indicated times. Percentage gap closure was quantified using ImageJ and results were normalised to 0 h time point measurements [36]. Error bars are SEM. ** p value < 0.01, * p value < 0.05.

