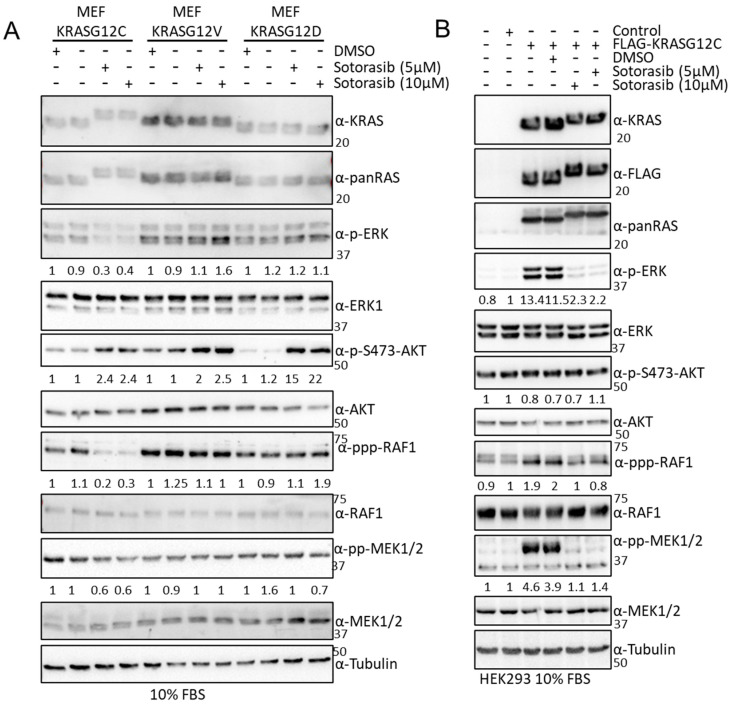
Figure 5.
(A) MEF-KRASG12C, -KRASG12V, and –KRASG12D were treated with the indicated amount of Sotorasib for 24 h. Cells were lysed, and the indicated proteins were blotted using the specific antibodies. Numbers show fold changes of phosphorylation of the indicated proteins with respect to their total level of expression. Intensity was measured using ImageJ 1.5. (B) HEK293 cells were transfected with the indicated constructs; 24 h after transfection the cells were treated with the indicated concentrations of Sotorasib for 24 h. Cell lysates were blotted with the indicated. Numbers show fold changes of phosphorylation of the indicated proteins with respect to their total level of expression. Intensity was measured using ImageJ. Experiments were repeated 3 times. The whole Western blot figure can be found in Supplementary Materials Original Blots and quantification for Figure 5.

