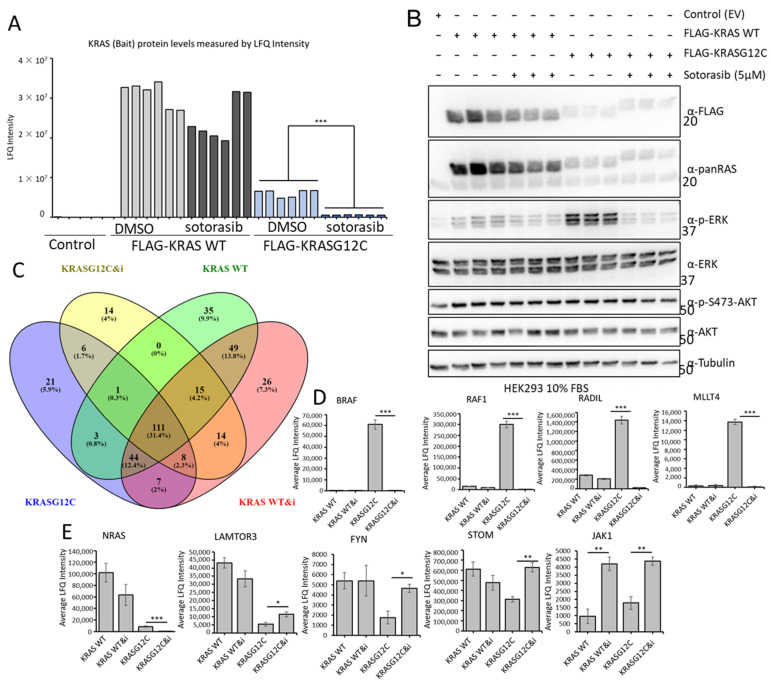
Figure 6.
(A) HEK293 cells were transfected with the indicated constructs and 24 h later they were treated with Sotorasib (5 μM) or DMSO for 24 h. FLAG IP were tryptic digested and analysed by MS. Graph shows the LFQ intensity of all the samples. *** p value < 0.01. (B) A fraction of the cell lysates of HEK293 cells used in A were blotted with the indicated antibodies. The whole Western blot figure can be found in Supplementary materials Original Blots and quantification for (B). (C) Venn diagram representation of the specific interactors identified in the MS-based proteomic screen in FLAG-KRAS WT (KRAS WT) or FLAG-KRASG12C (KRASG12C) immunoprecipitates treated with DMSO or 5 μM Sotorasib (i) for 24 h. (D,E) Graphs show average LFQ intensity of the indicated proteins in the different IPs. Error bars show SEM. * p value < 0.05, ** p value < 0.01.

