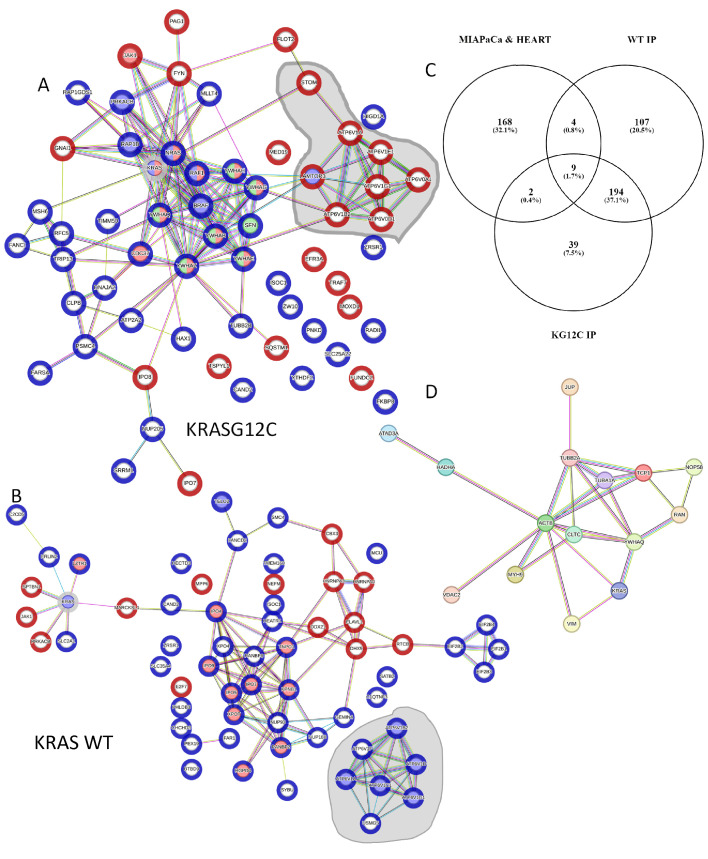
Figure 7.
(A) Reconstructed network using StringDB of the dynamic interactome of KRASG12C (grey halo) in HEK293 cells identified in the AP-MS screen. Blue halo on proteins shows significantly increased binding to KRASG12C versus KRASG12C treated with Sotorasib p < 0.05. Red halos show significantly increased binding to KRASG12C treated with Sotorasib versus untreated KRASG12C p < 0.05. Proteins with blue nodes are involved in MAPK, proteins red nodes are PI3K related, and green nodes 14-3-3 domain superfamily related. Grey area shows proteins involved in lysosomal function and edges show evidence for interaction. (B) Reconstructed network using StringDB of the dynamic interactome of KRAS WT (grey halo) identified in the AP-MS screen. Blue halo on protein shows significantly increased binding to KRAS WT versus KRAS WT treated with Sotorasib p < 0.05. Red halo show significantly increased binding to KRAS WT treated with Sotorasib versus KRAS WT p < 0.05. Proteins with blue nodes are involved in mTOR signalling pathway, proteins red nodes are RAS GTPase binding. Edges show evidence for interaction. (C) Venn diagram representation of the proteins identified as specific interactors or KRAS WT and KRASG12C in our study with the proteins identified to be binding Sotorasib in MIAPaCa cells and heart tissue by Wang et al. [14]. (D) Network constructed using string DB of the 15 proteins that are in the intersection of the Venn diagram shown in (C). Edges show evidence for interaction (high confidence).

