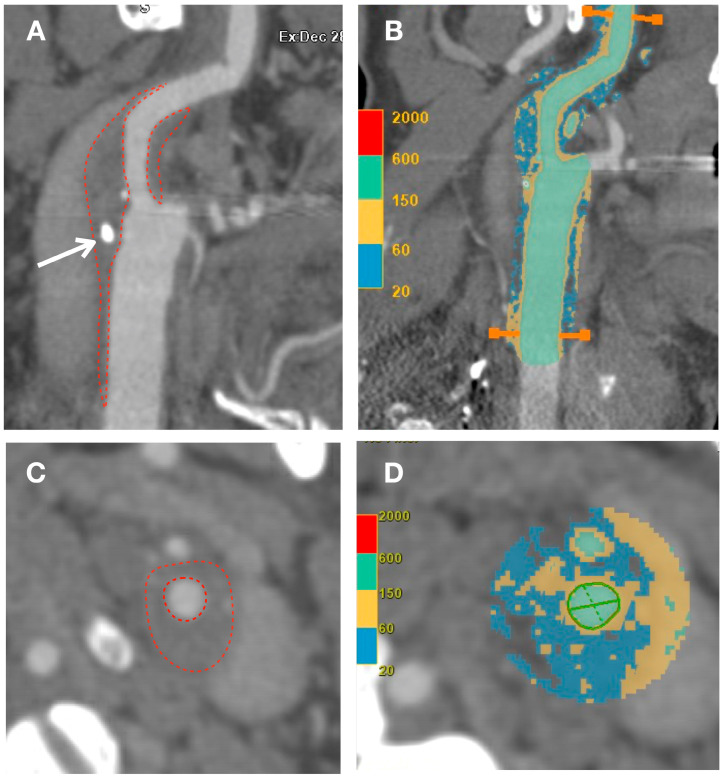
Figure 5.
CT imaging can be used for the analysis of carotid plaque by assessing the density of its components, which is measured in Hounsfield units (HU). Image (A) shows a sagittal view of CCA and ICA with a low-density plaque (red lines) and spotty calcification (white arrow). Image (C) displays an axial view of the ICA. Images (B) (sagittal view) and (D) (axial view) represent the automated color coding of carotid plaque components. The predominant color is blue, which correlates with a lipidic core (<60 HU).

