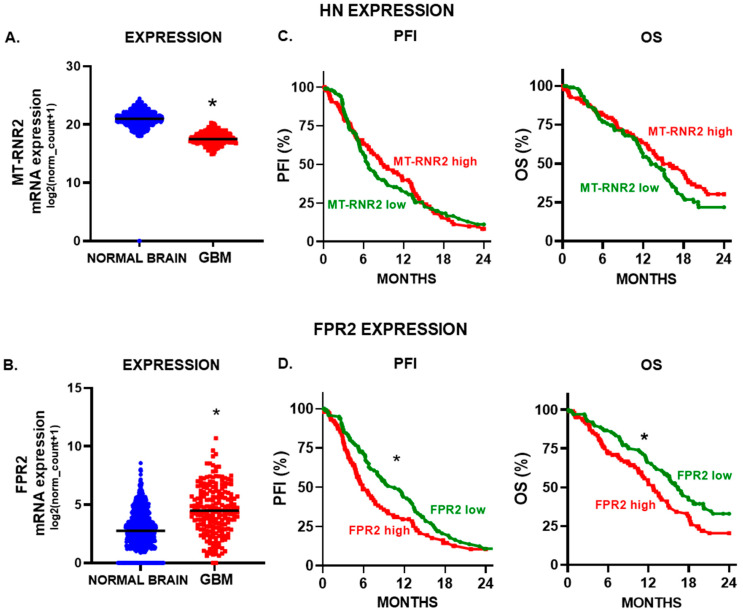
Figure 7.
HN and FPR2 expression and prognosis of GBM patients. The mRNA expression of humanin (A) (MT-RNR2) and (B) FPR2 was evaluated using transcriptomic data of normal brain tissue (GTEx, n = 1141) and GBM biopsies (TCGA Pan-Cancer database, n = 207). *, p < 0.05; Mann-Whitney U test. Kaplan–Meier curves were created using UCSC Xena database and TCGA LGG-GBM cohorts. Progression-free-interval (PFI) and overall survival (OS) curves of GBM patients that were stratified according to (C) HN (MT-RNR2) and (D) FPR2 mRNA expression levels using the median of expression as a cut-off point. * p < 0.05, Log rank (Mantel–Cox) test.

