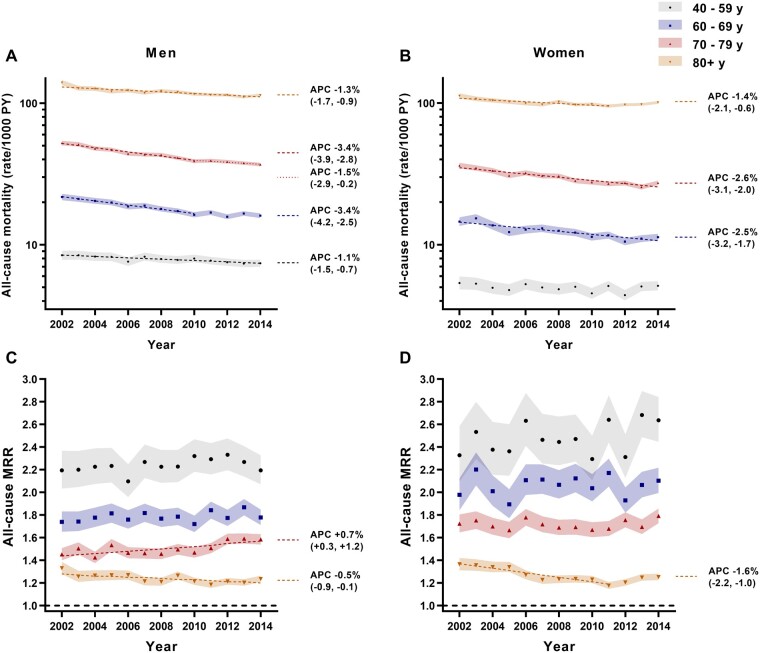
Figure 2.
Age-specific all-cause mortality rates per 1000 person-years (PY) in men (A) and women (B) with type 2 diabetes, and corresponding MRRs (C [men] and D [women]) by calendar year. 95% CIs are depicted by shading. Regression lines (dashed/dotted) are displayed for time periods over which the APC in mortality rate or MRR was different from zero at P < 0.05. Thus, termination of a regression line prior to 2014 indicates a joinpoint at the year of termination, with the APC thereafter not different from zero (P > 0.05). Where time trends at P<0.05 were present either side of a joinpoint, multiple APCs are reported. Note: corresponding data for the 10–39 year age group are reported in Supplementary Table S2, available as Supplementary data at IJE online.

