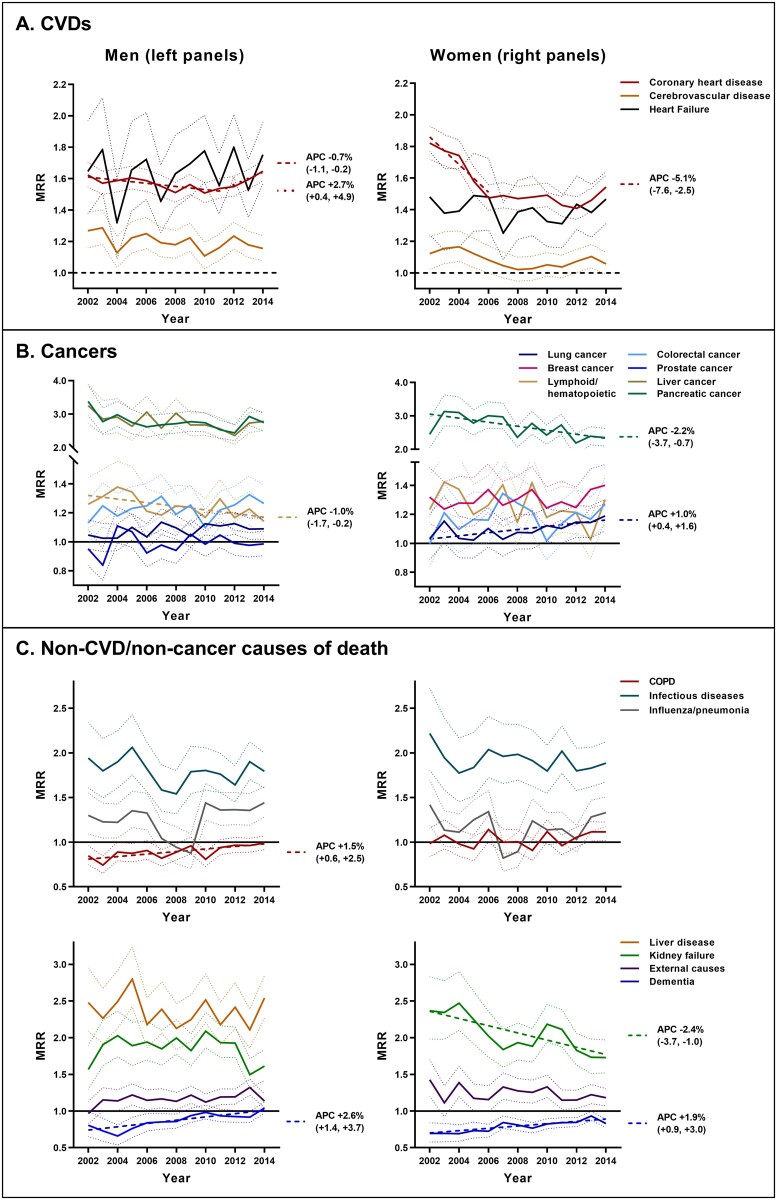
Figure 4.
MRR by calendar year for the specific causes of death that contributed >5% of all CVD deaths (A), cancer-related deaths (B) and non-CVD/non-cancer mortality (C). 95% CIs are depicted by dotted lines. Regression lines (dashed) are displayed for time periods during which the APC in MRR was different from zero at P < 0.05.

