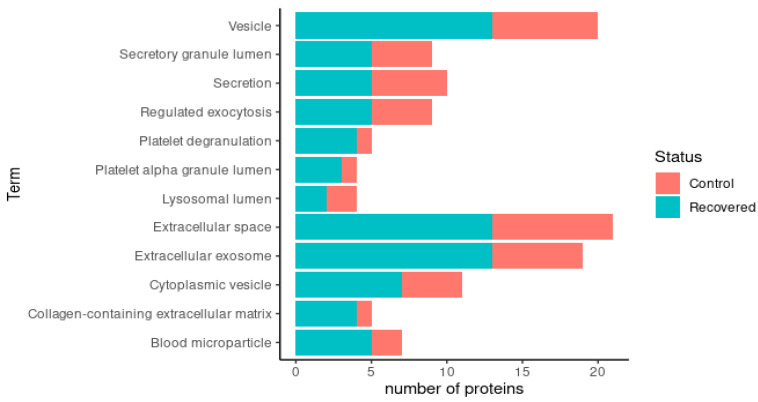
Figure 9.
Representation of enriched GO terms in the recovered group in comparison to control. The total number of proteins associated with each term equals the total length of the bar. The most abundant proteins in colostrum from control women are represented by the red part and the most abundant proteins in colostrum from recovered women are represented by the turquoise blue part.

