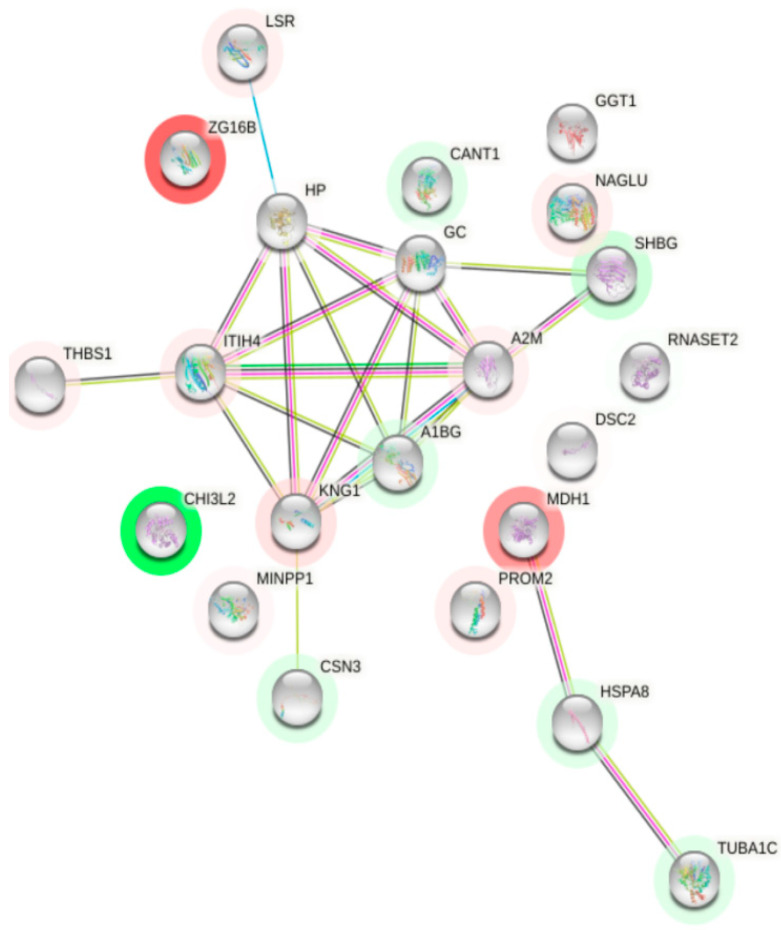
Figure 10.
Interaction network of differentially expressed proteins in recovered group. Proteins whose expression decreases in recovered group are shown in red and those whose expression increases are shown in green. Black lines indicate co-expression. Proteins that have appeared in the same articles by making a bibliographic search are shown in line green. Pink lines indicate proteins whose interaction has been experimentally determined in humans. Blue indicates that it has been documented in a database.

