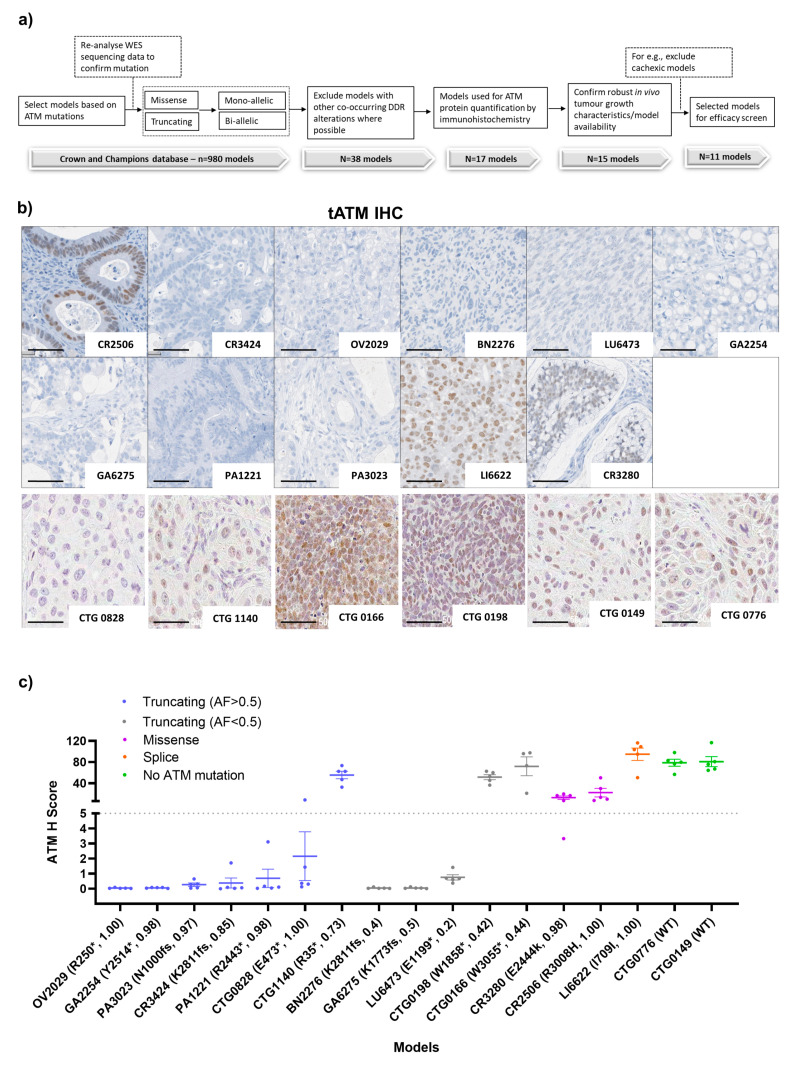
Figure 1.
PDX model selection and the baseline profile of ATM protein expression and genetic alterations. (a) Strategy for the selection of PDX models, (b) representative IHC images of tATM in 17 PDX (scale bar represents 50 µm), and (c) comparison between the ATM H score and different type of ATM alterations across 17 PDX models. Letters and numbers in brackets on the x-axis denote the ATM protein change and variant allele frequency, respectively. * Indicates the predicted truncating ATM mutation and fs indicates a frameshift mutation. Data represented as the mean ± SEM (n = 4 or 5 per model). Images were captured at 40× magnification. For detailed IHC staining, refer to the method section.

