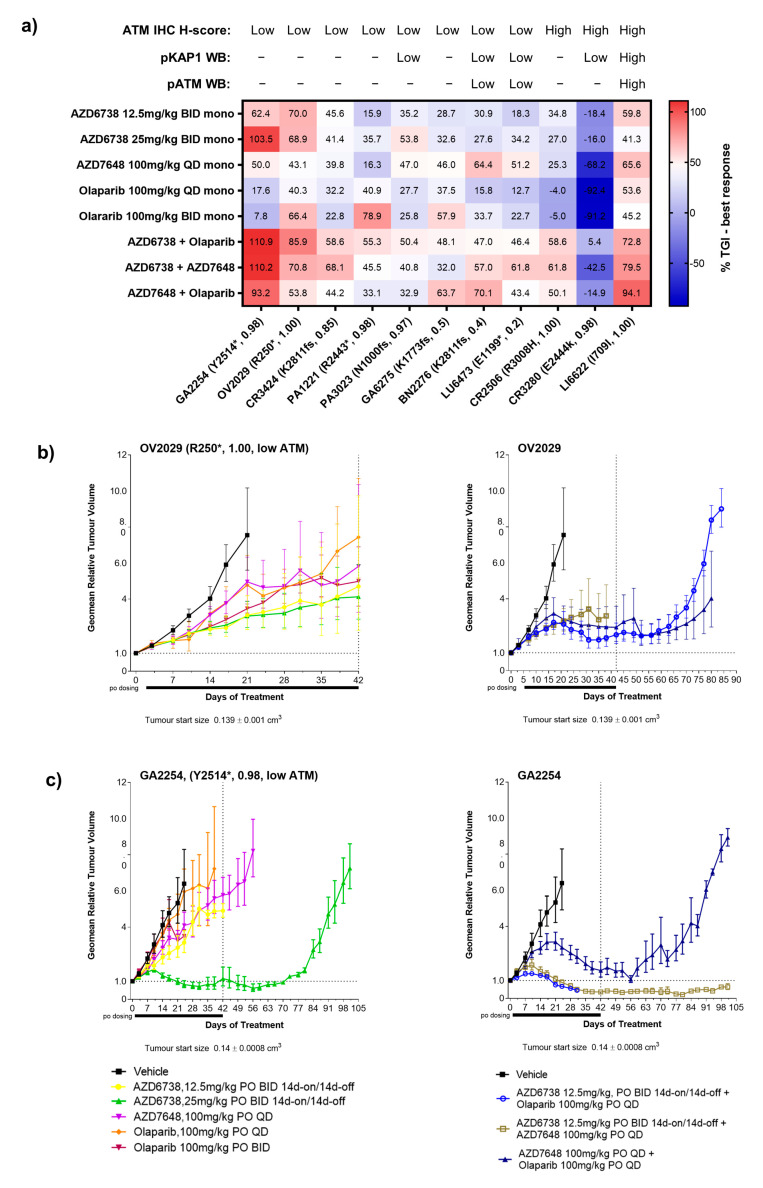
Figure 3.
Antitumour responses in PDX models following treatment with DDR agents. (a) Heat map of the best response of DDRi agents both as a monotherapy and combination therapy in 11 PDX models. (b,c) Examples of tumour growth curves in GA2254 and OV2029 PDX models with Y2514* and R250* truncating ATM mutation, respectively, following monotherapy and combination therapy with DDR agents. AZD6738 was used at 12.5 mg/kg BID (7ON 7OFF) in combination therapy with olaparib or AZD7648 at 100 mg/kg QD continuous. Tumour growth curves represent the geometric relative tumour volume ± SEM (n = 5, per treatment arm). Dotted lines in tumour growth curves represent the end of the dosing period. The best response was calculated as the maximum % tumour growth inhibition (TGI) following a minimum 14 days of tumour growth for each respective model. Letters and numbers in brackets refer to the ATM protein change and variant allele frequency, respectively. * Indicates the predicted truncating ATM mutation and fs indicates a frameshift mutation. For the ATM status, models were labelled as low (<5) and high (>5) based on the IHC ATM H score. For the pATM and pKAP1 expression profiles, models were classed as low expressing relative to the expression level of these markers in LI6622 (pATM/pKAP1 high).

