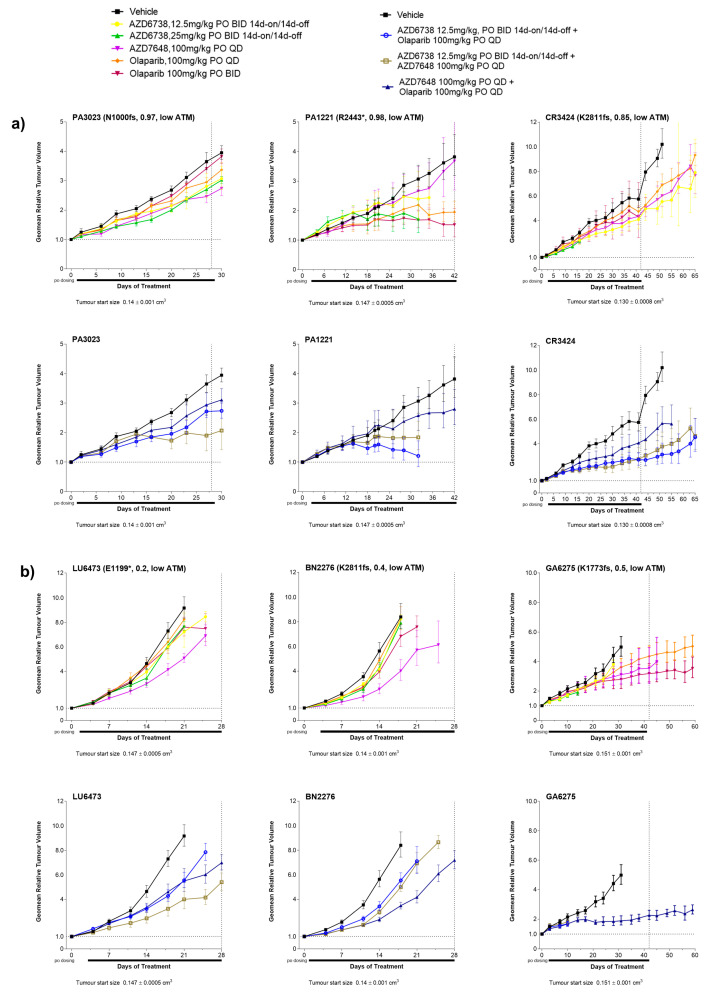
Figure 4.
Antitumour responses in PDX models with truncating ATM mutations and low ATM IHC H scores (less than 5). (a) Representative tumour growth curves in PDX models with ATM truncating mutations with a variant allele frequency of 0.5 and above and (b) representative tumour growth curves in PDX models with ATM truncating mutation with an allele frequency of 0.5 and below (monoallelic) following treatment with DDR agents. AZD6738 was used at 12.5mg/kg BID (7ON 7OFF) in combination therapy with olaparib or AZD7648 at 100 mg/kg QD. Tumour growth curves represent the geometric relative tumour volume ± SEM (n = 5, per treatment arm). Dotted lines in tumour growth curves represent the end of the dosing period. Letters and numbers in brackets represent the ATM protein change and variant allele frequency, respectively. * Indicates the predicted truncating ATM mutation and fs indicates a frameshift mutation. For the ATM status, models were labelled as low (<5) and high (>5) based on the IHC ATM H score.

