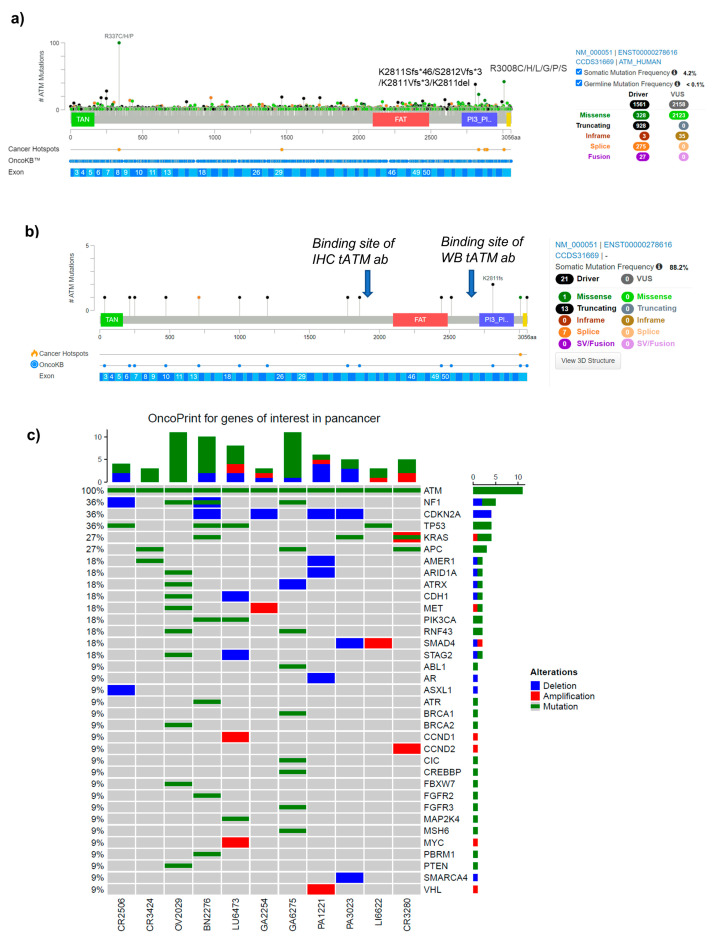
Figure A1.
ATM alterations in PDX models. (a,b) Represents the ATM mutation lollipop in clinical samples and PDX models, respectively. # refers the number of muations, * indicates a truncating ATM alteration, fs indicates a frameshift mutation and del a suspected deletion (c) represents the oncoprint of pan-cancer gene alteration across PDX models used in this study.

