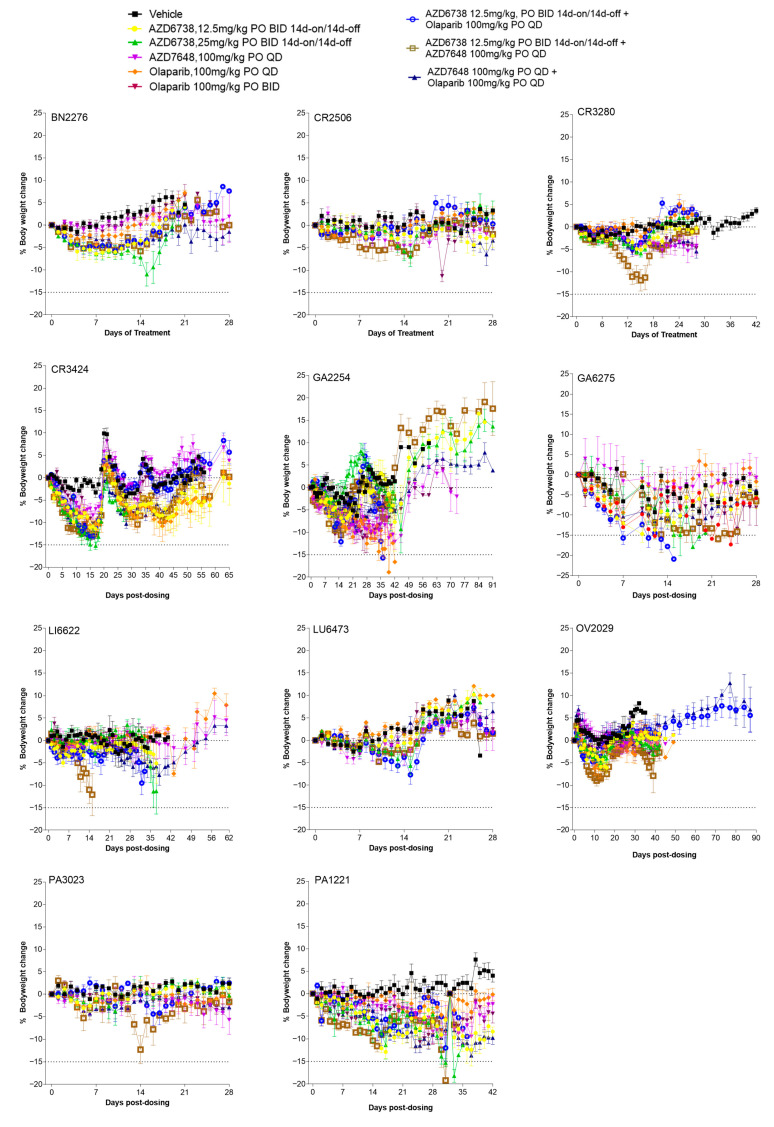
Figure A2.
Body weight change following treatment with DDRi agents in 11 PDX models. Body weight change was plotted as the % change in body weight with respect to body weight at the start of dosing. For some models, body weight change beyond the dosing period is also plotted. Values represent the mean ± SEM or individual animal depending on the number of animals remaining in the study.

