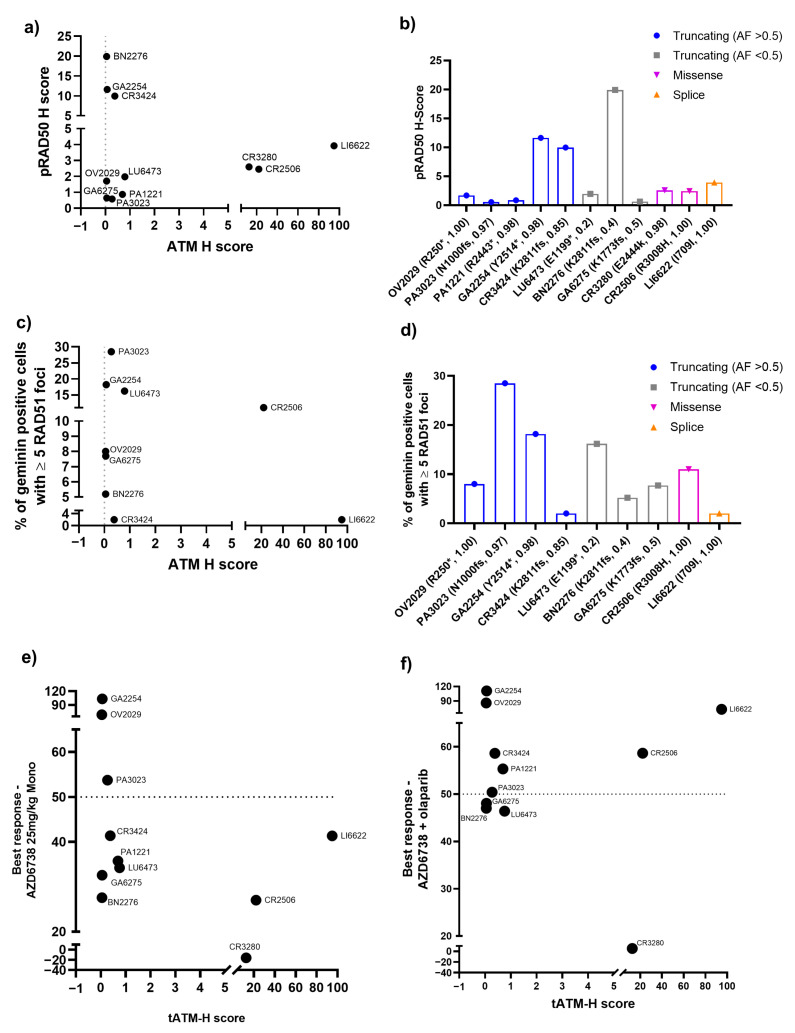
Figure A3.
Correlation of ATM expression and mutation types with pRAD50 expression and RAD51 foci. (a) Comparison of ATM and pRAD50 H-score, (b) comparison between the pRAD50 H-score and different types of ATM alterations across PDX models, (c) comparison of the ATM H-score and RAD51 foci score, (d) comparison between RAD51 foci scores and different types of ATM alterations across PDX models, and (e,f) represents the tATM H score (IHC method) correlation with best responses following AZD6738 monotherapy and combination with olaparib, respectively. Letters and numbers in brackets on the x-axis denote the ATM protein change and variant allele frequency (VAF), respectively. * Indicates the truncating ATM alteration and fs indicates a frameshift mutation.

