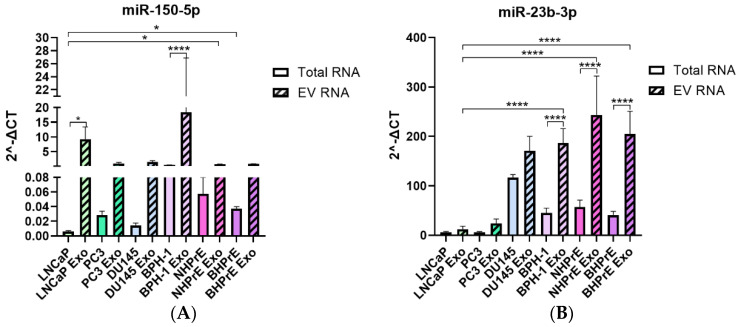
Figure 3.
Comparative analysis of miRNA expression in EVs from tumoral and non-tumoral PCa cell lines. (A) Bar graph depicting the expression levels of miR-150-5p. EVs from LNCaP and BPH-1 exhibited the highest levels of miR-150-5p. (B) Bar graph illustrating the expression of miR-23b-3p. EVs from all non-tumoral cells demonstrated a higher enrichment of miR-23-3p. * p < 0.05, **** p < 0.0001.

